




Summary
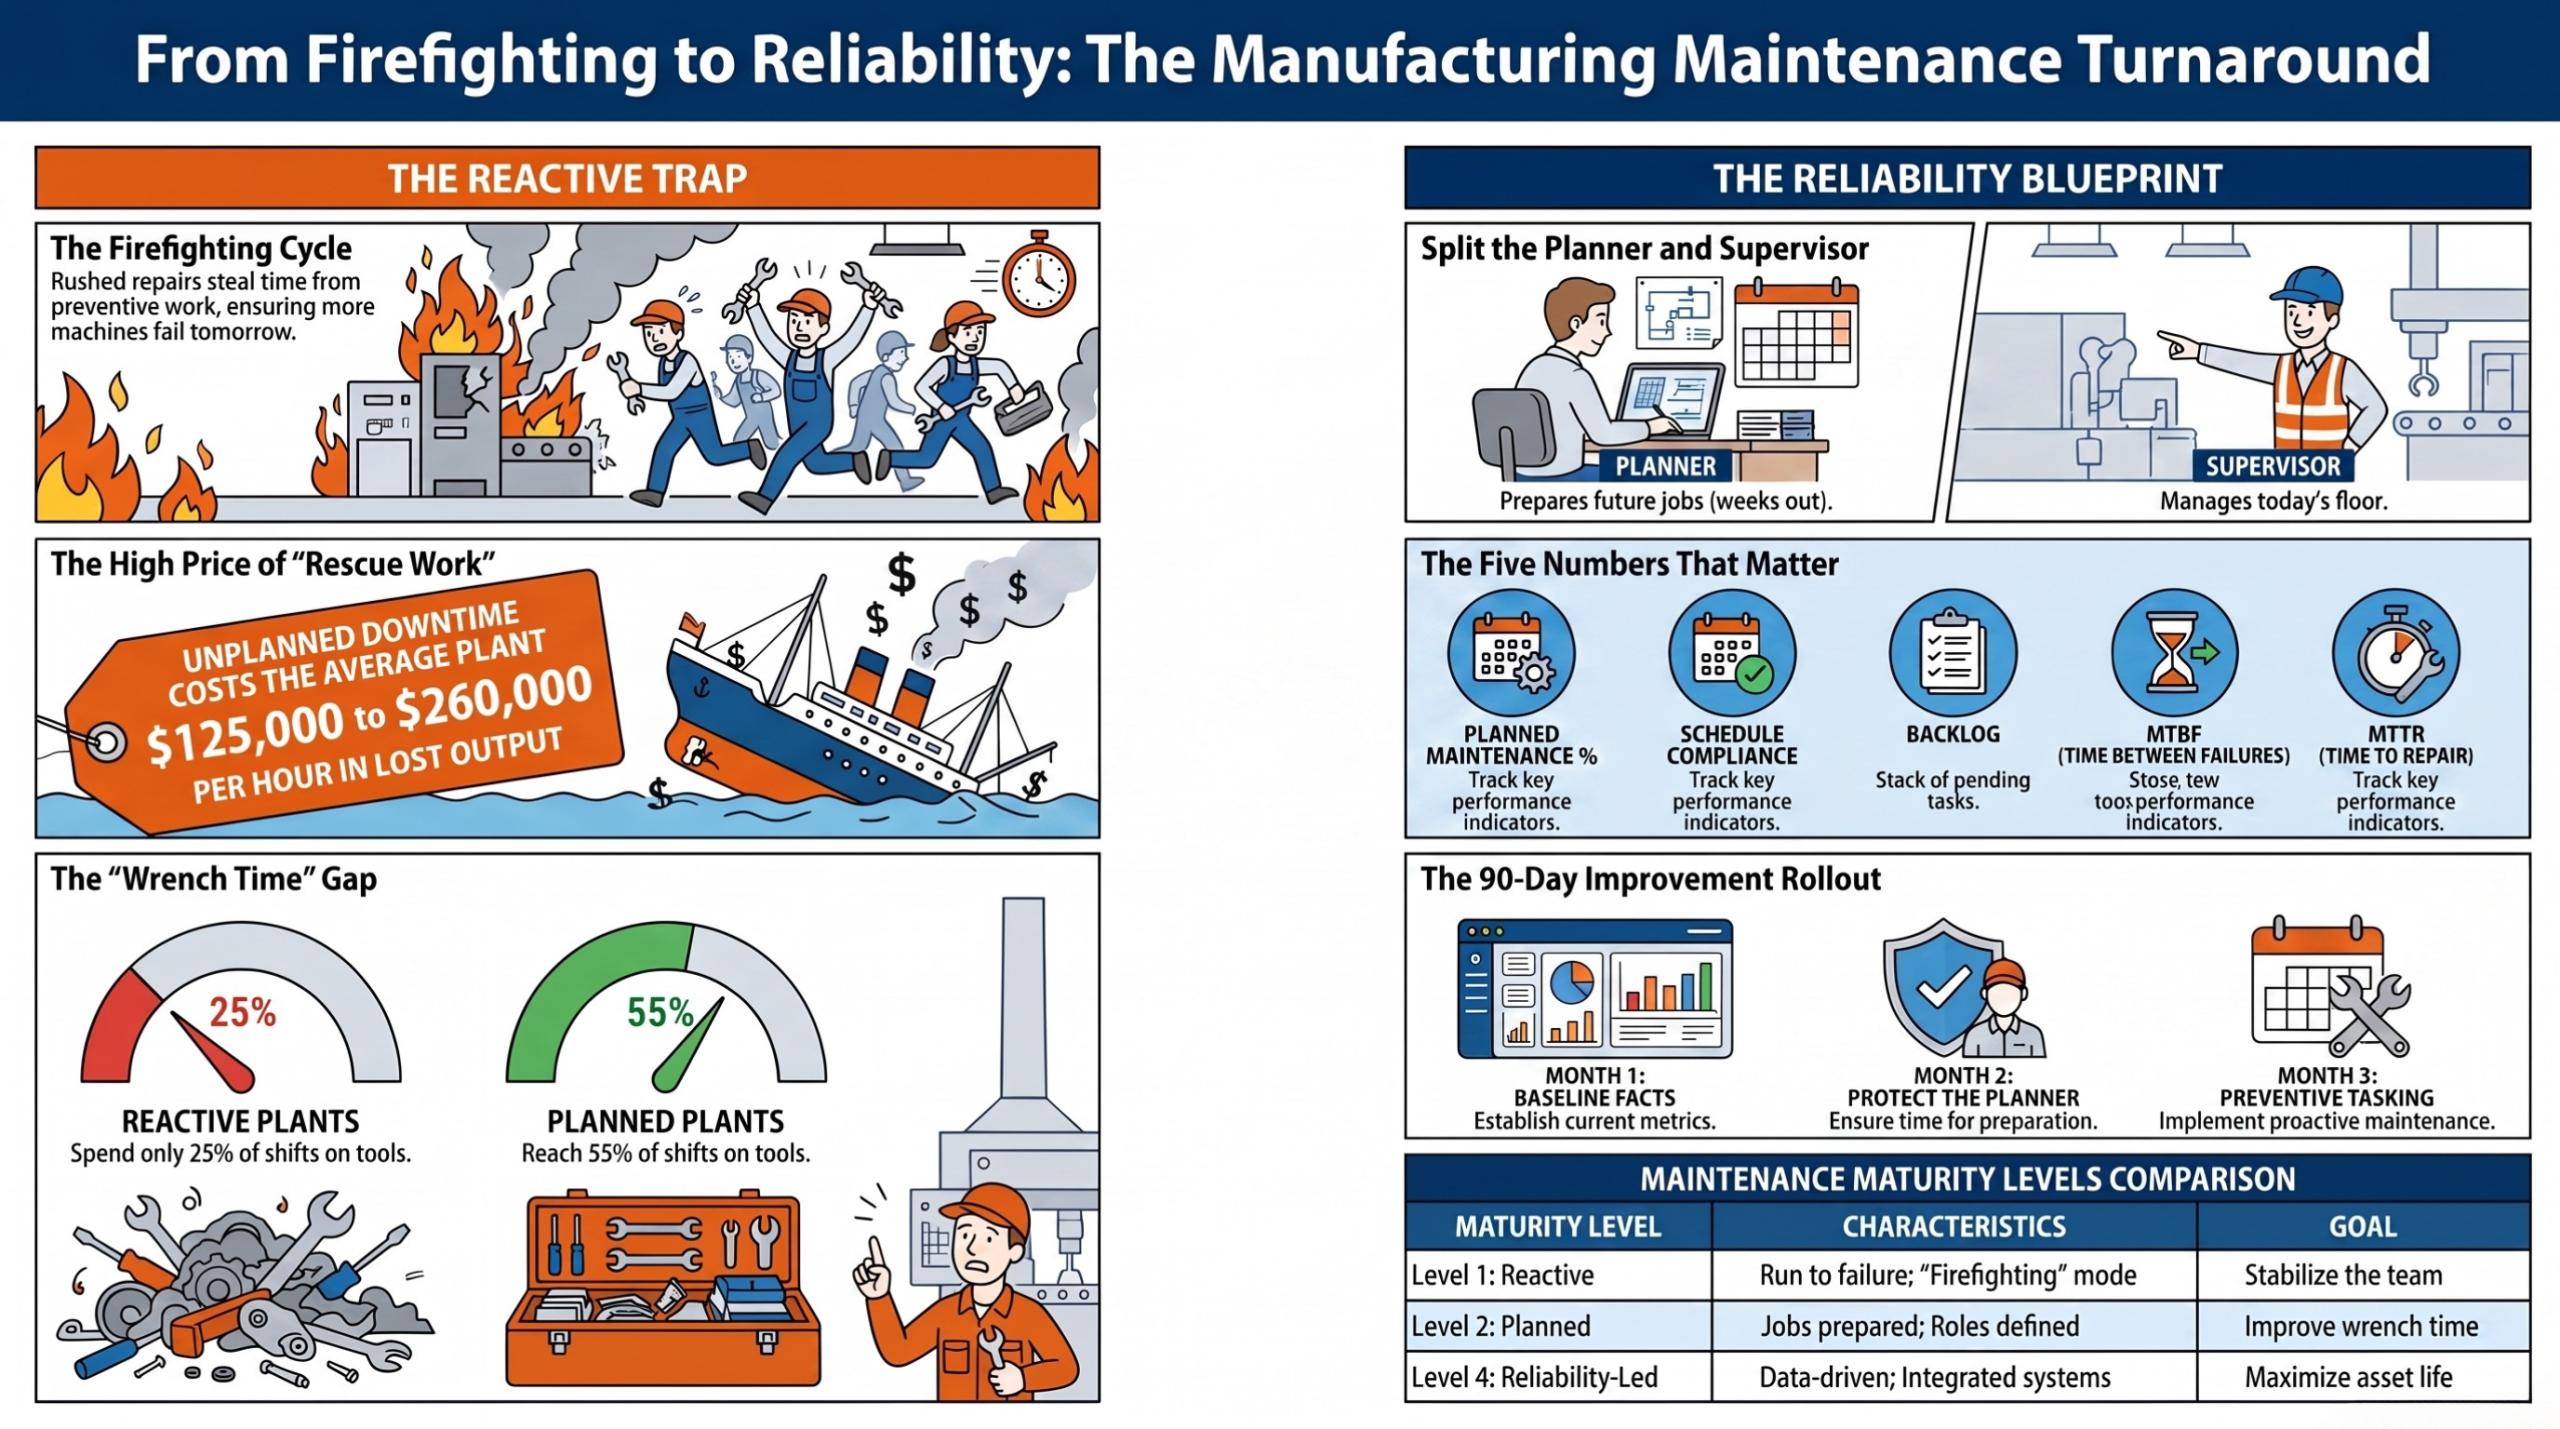
The article explains how manufacturing maintenance can shift from reactive firefighting to proactive, planned work. It outlines the team structure, skills tracking, planning/scheduling, KPI monitoring, spares management, and culture changes needed to reduce downtime, plus a 90-day rollout plan and how Acumatica can support the process.
Key points
- Main problem: Many plants waste time on breakdowns instead of prevention, leading to major downtime costs and higher risk.
- Recommended structure: Use clear maintenance roles, a skills’ matrix, and a planner/scheduler split to keep work organised.
- Planning matters: Planned and scheduled work improves wrench time, schedule compliance, and overall reliability.
- Track a few key metrics: Planned maintenance percentage, schedule compliance, backlog, downtime by asset, MTBF, and MTTR.
- System and culture: Manage parts, work orders, production, and finance in one system, and reward prevention—not just emergency repair.
Introduction
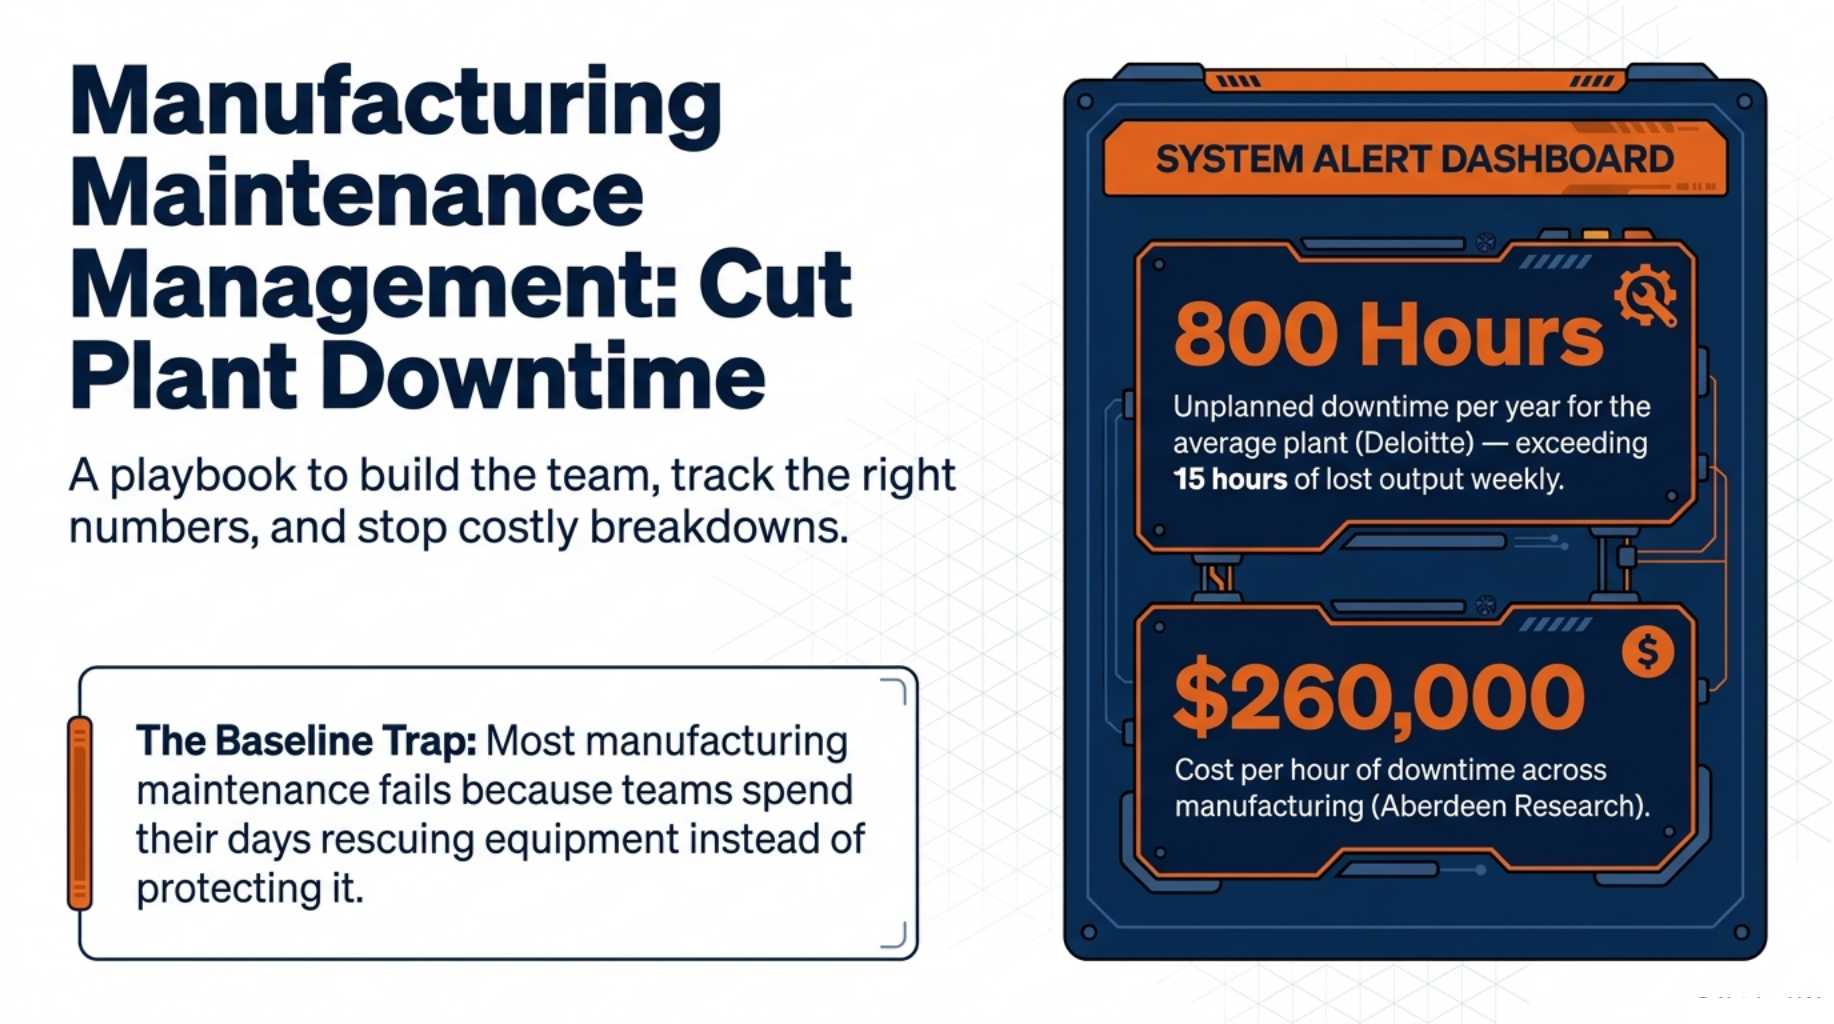
Manufacturing maintenance management fails in most plants for one reason. The team spends the day rescuing equipment instead of protecting it. The effort is honest, and the plant still loses money.
Deloitte puts unplanned downtime at roughly 800 hours a year for the average plant. That exceeds 15 hours of lost output every week. Aberdeen Research has costed one hour of downtime at about USD 260,000 across manufacturing.
This guide shows you how to break that pattern. You get a team structure, a skills’ matrix, a planning system, five numbers worth tracking, and a 90-day plan you can start on Monday. Every part of it works in a plant of 20 people or 200.
Why Most Maintenance Teams Stay Stuck in Firefighting Mode
Every rushed repair steals time from the work that prevents it.
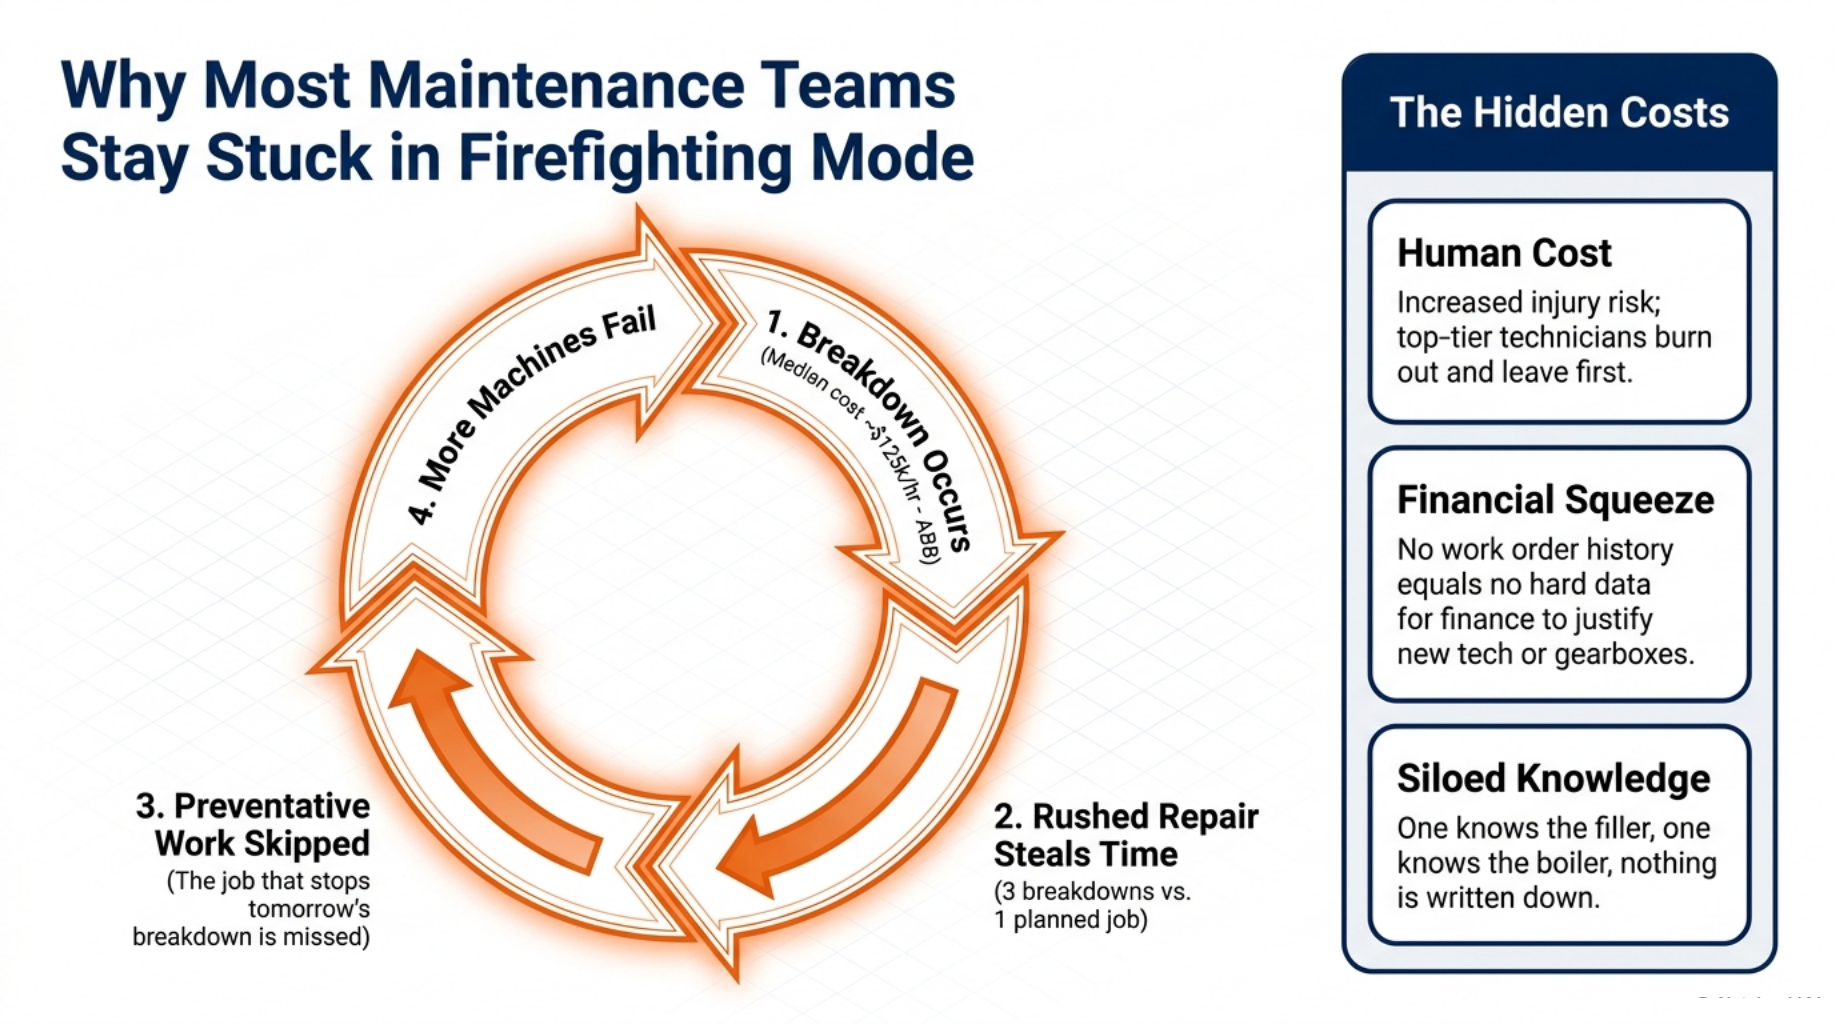
Ask a maintenance manager what they did today. Most will list three breakdowns and one job they never reached. That last job is usually the one that would have stopped tomorrow’s breakdown.
This is the trap. Reactive work eats the hours set aside for planned work, so more machines fail, so more hours go to rescue. The cycle feeds itself.
The cost is not only lost production. ABB surveyed 3,215 plant maintenance decision makers and found a median downtime cost near USD 125,000 an hour. Rushed repairs also raise the risk of injury, and good technicians leave first when every shift is a scramble.
A second cost hides well. A plant with no work order history has no case to take to finance. When the manager asks for two more technicians or a spare gearbox, they bring a story and no numbers.
Skills carry the same risk. In many plants, one person knows the filler, one knows the boiler, and neither has written anything down. None of this is the technicians’ fault. It is what happens when the system around them rewards speed over preparation.
Build a Maintenance Team Structure That Holds Up
Roles beat heroes. Structure is what makes a team repeatable.
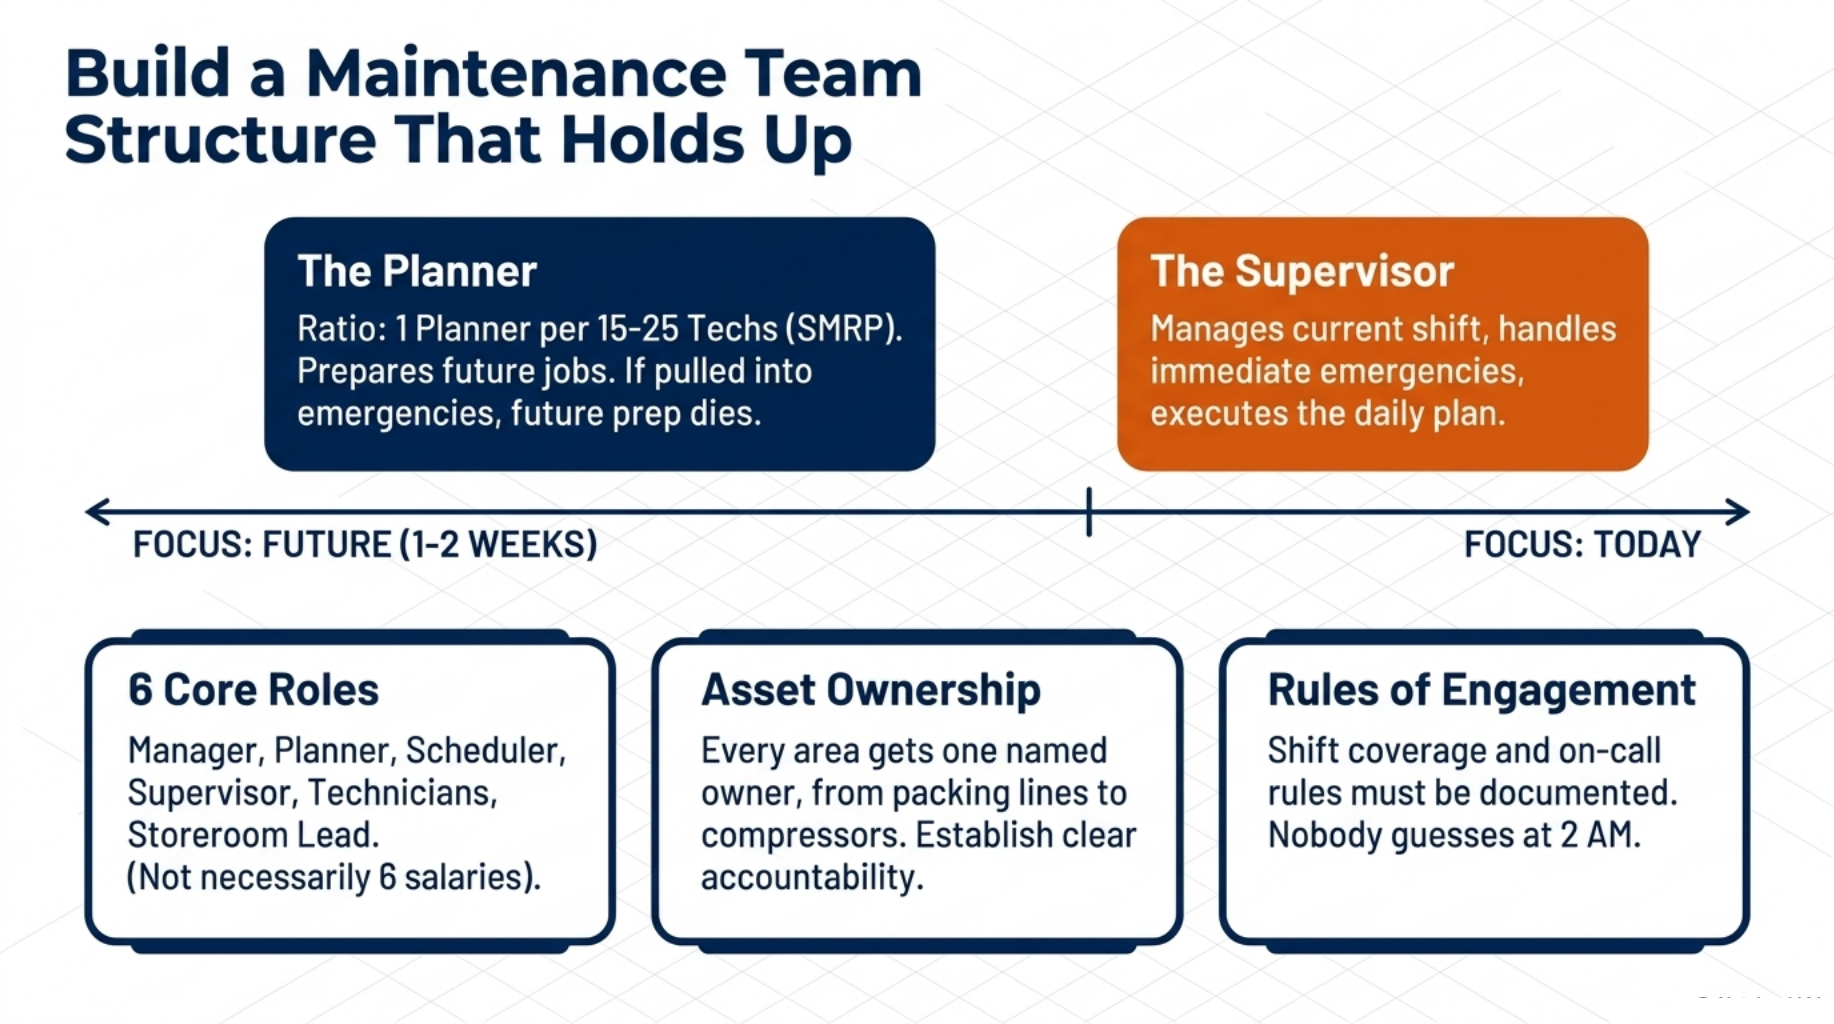
A plant of 20 to 60 people needs six roles, not six new salaries. Maintenance manager, planner, scheduler, supervisor, technicians, and a storeroom lead. One person can hold two roles, as long as the roles stay separate in the diary.
The split that matters most is planner and supervisor. The planner works one to two weeks ahead on future jobs. The supervisor runs today.
Reliability groups such as SMRP put the ratio at one planner for every 15 to 25 technicians. The moment a planner gets pulled into today’s emergency, next week’s work stops being prepared.
Write down shift coverage and on call rules so nobody guesses at 2am. Then give every asset area one named owner, from the packing line to the compressors.
Build a Skills Matrix That Shows Real Gaps
Draw a grid. Technicians down the side, assets, and tasks across the top. Score every box on four levels: cannot do, can watch, can do alone, can teach.
The gaps jump off the page. One plant found that four of its five night shift technicians could not isolate the ammonia plant on their own. Training them cost a day. The alternative was a call-out every time the compressor tripped.
Use the grid to plan training, build shift cover, and spot who is ready for the planner seat. Any task with only one green box is a risk you can name and fix.
Review the grid every quarter and after every new machine lands. It takes an hour, and it turns training from a guess into a plan.
Plan and Schedule Work Before It Finds You
A job planned twice runs once. A job unplanned runs forever.
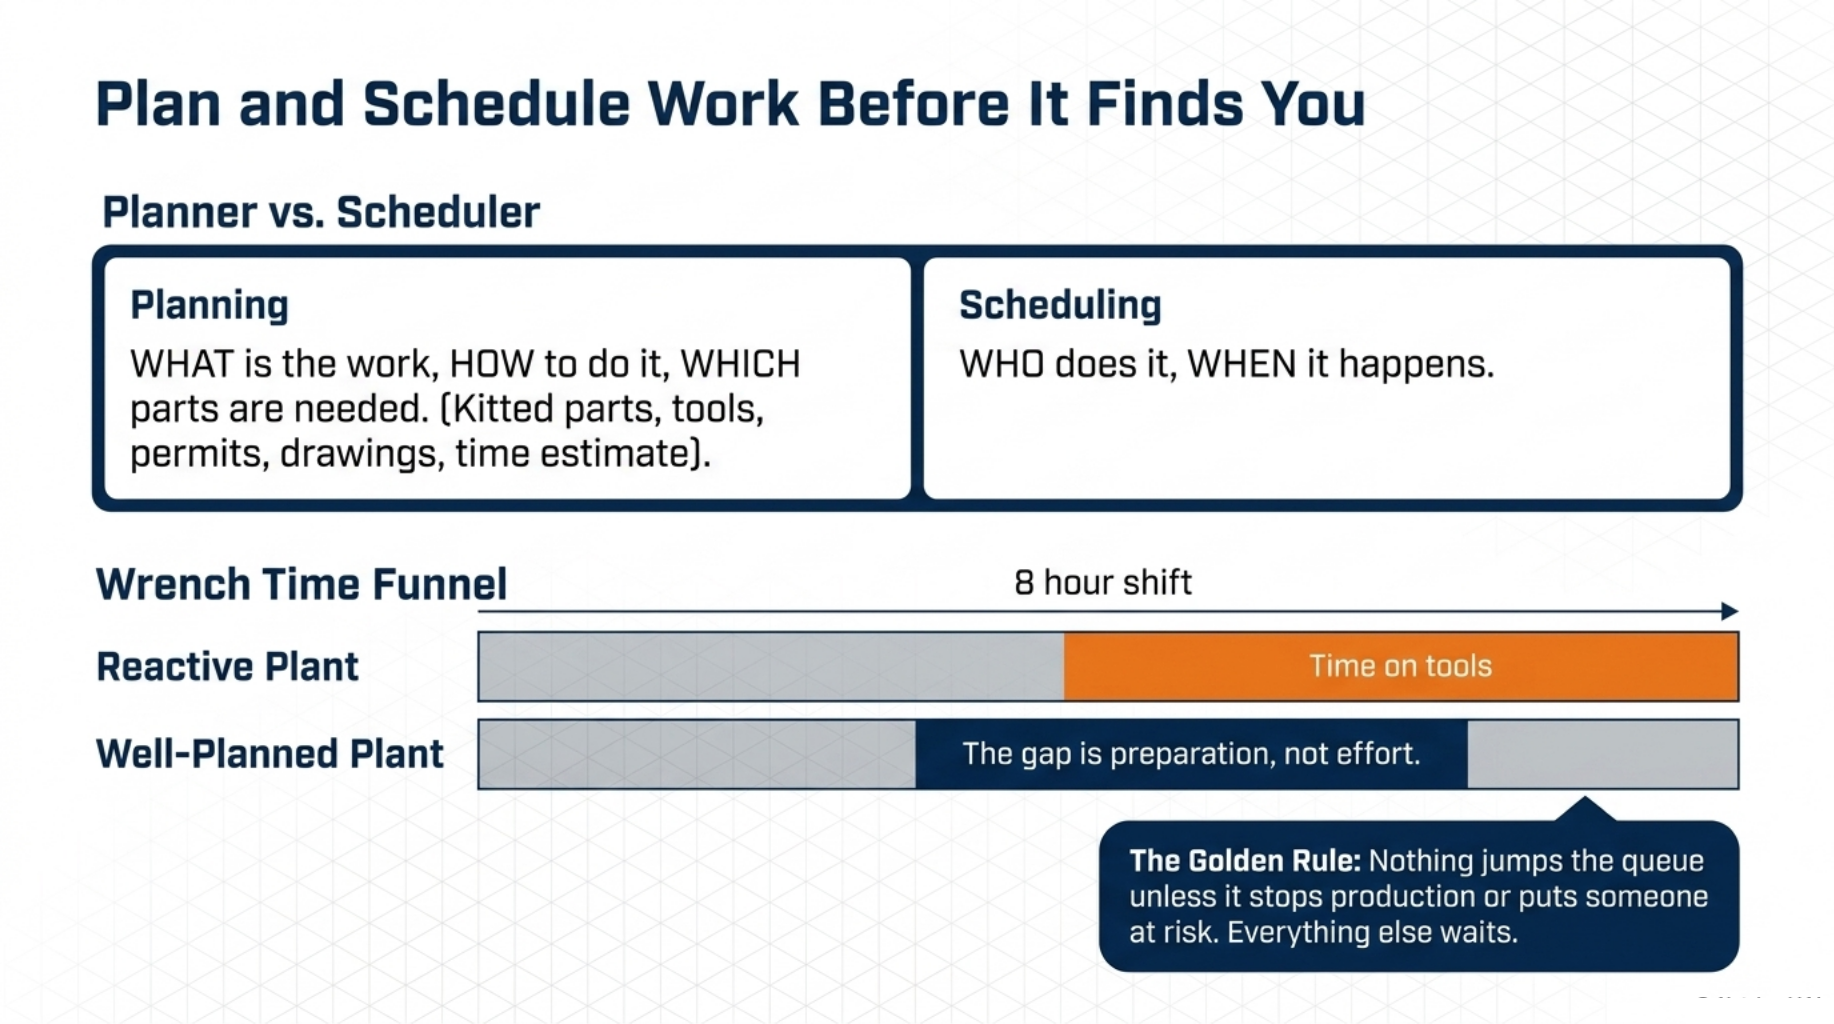
Planning and scheduling are two different jobs. Planning answers what the work is, how to do it, and which parts it needs. Scheduling answers who do it and when.
A job is ready when the technician can walk to the machine and start. That means parts kitted, tools listed, permits raised, drawings attached, and a time estimate drawn from the last time the job ran.
Wrench time is the share of a shift spent on tools. Figures quoted across the reliability field put it at 25 to 35% in reactive plants and 45 to 55% in well-planned ones. The gap is not effort, it is preparation.
Protect the schedule with one screening rule: nothing jumps the queue unless it stops production or puts someone at risk. Everything else waits for next week’s plan. Say that rule out loud in front of production once, and you will only need to say it once.
Run a Weekly Schedule Meeting That Works
Thirty minutes, same day, same time. Production says which lines it can release. Maintenance says which jobs are ready to run.
Freeze the schedule once you agree it. At the end of the week, measure how much of it was completed. That figure is schedule compliance, and it tells you whether the plan was real.
Jobs that slip go back into the backlog with a reason code. The codes show the pattern, whether it is missing parts, no access, or no people.
Track the KPIs That Prove Progress
You cannot fix what you never counted.
Five numbers are enough. Any more and nobody reads the report.
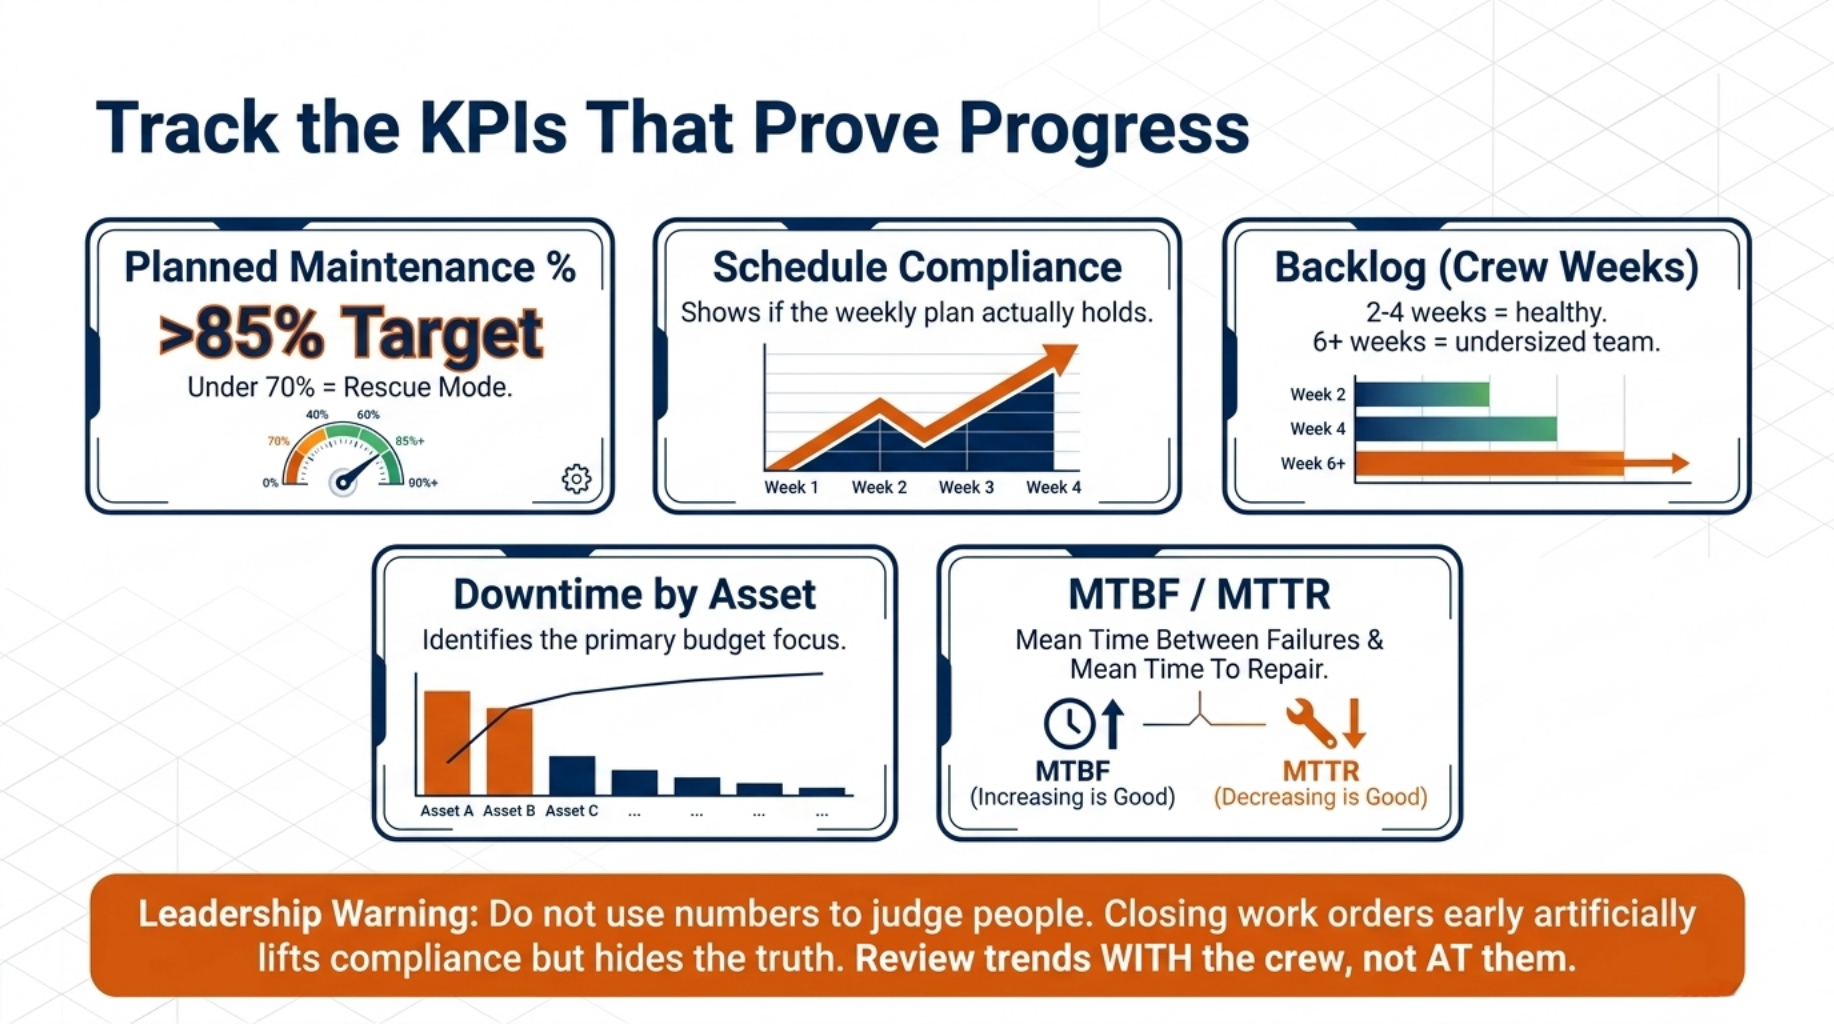
Start with planned maintenance percentage. Divide planned labour hours by total labour hours. Leading plants sit above 85%, and anything under 70% means the plant is still in rescue mode.
Schedule compliance shows whether the plan holds. Backlog, counted in crew weeks, shows whether the team is sized right. Two to four weeks is healthy, and six or more means work is being pushed out.
Downtime by asset tells you where to spend next. One line usually accounts for most of the loss, and that is the line your budget request should be built around.
One warning. Numbers get gamed the moment they are used to judging people. Closing a work order early lifts compliance and hides the truth, so review the trend with the crew, not at them.
MTBF and MTTR in Plain Terms
MTBF is mean time between failures. Take the running hours of an asset and divide by the number of failures. It answers one question: how long does this machine run before it stops?
MTTR is mean time to repair. Measure from the moment the fault is found to the moment production restarts. That includes waiting for parts and waiting for a permit, not just time on the tools.
Rising MTBF with steady MTTR means prevention is working. Falling MTBF with fast MTTR means you have a skilled team and a missing plan.
Get Control of Parts and Spares
The fastest technician still waits on a missing part.
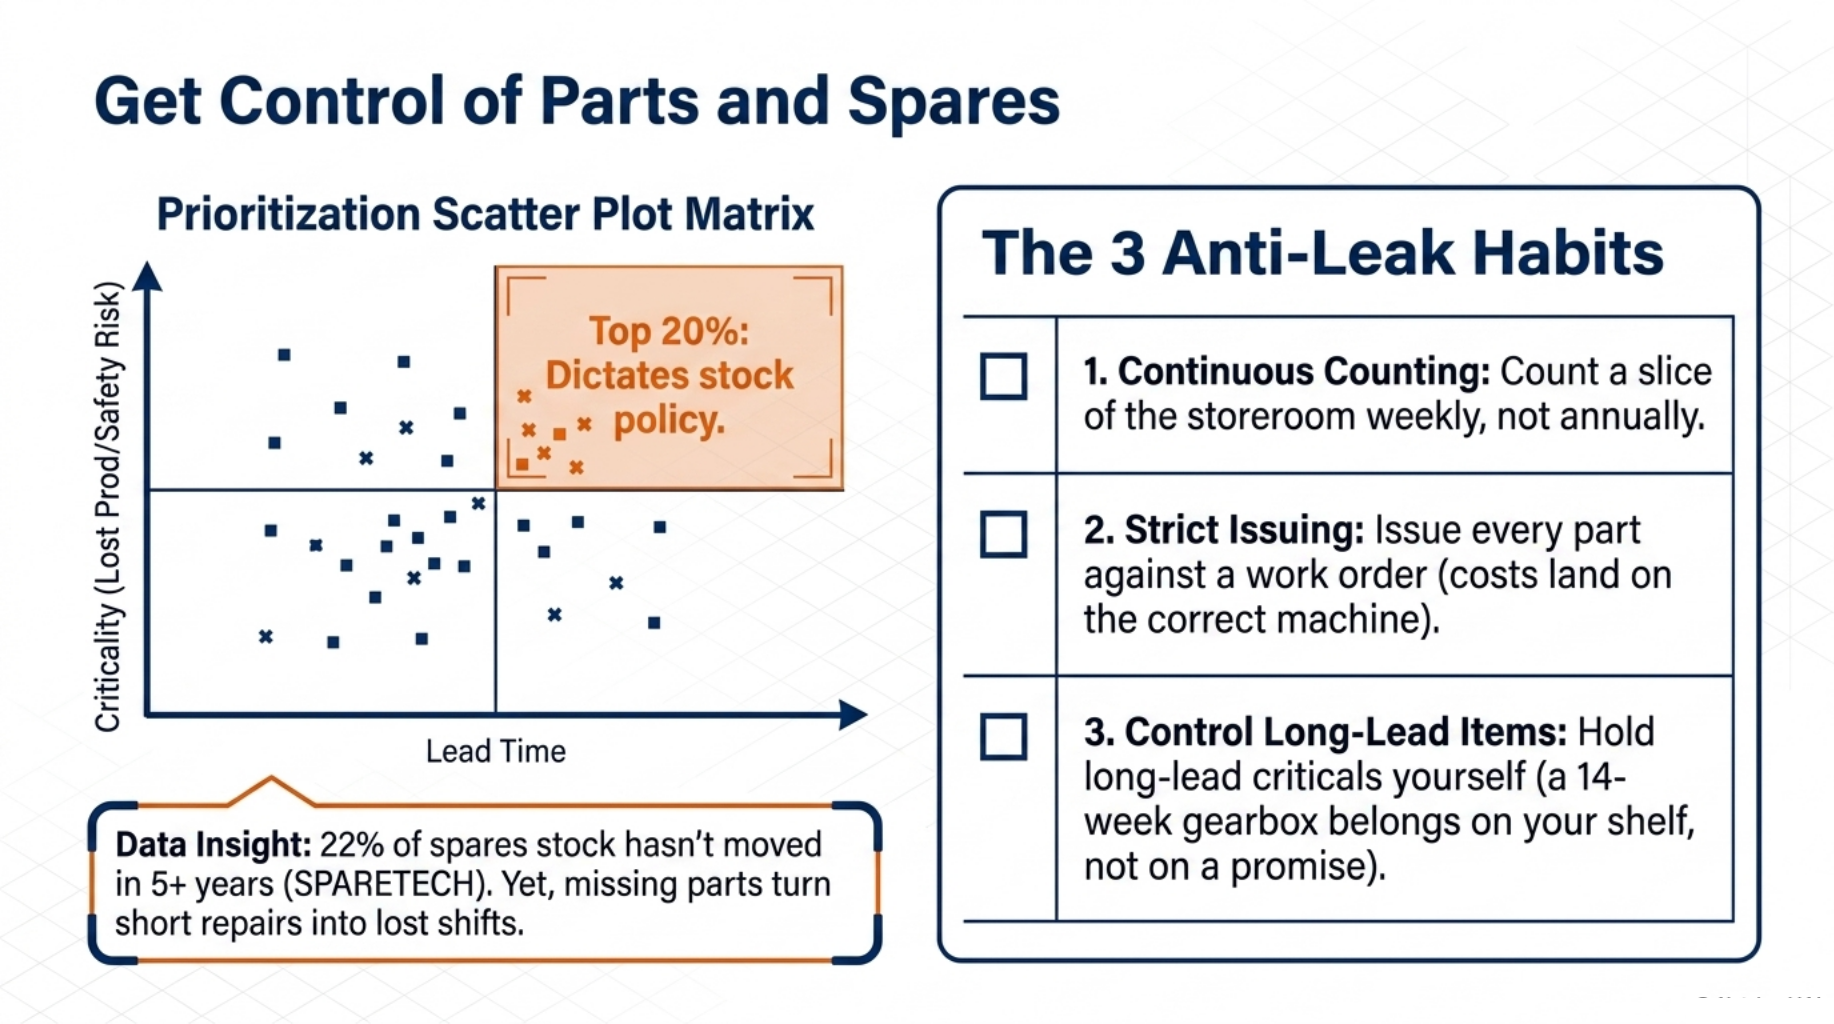
Rank your assets before you touch stock levels. Score each one on lost production, safety risk, and the lead time on its parts. The top fifth of that list sets your stock policy.
Then set min and max levels for those items, and build a parts list against every critical asset. The planner can kit a job in minutes instead of hunting through bins.
The waste runs both ways. A survey of 300 manufacturing executives by SPARETECH found that 22% of spares stock had not moved in more than five years. At the same time, a missing part is one of the most common reasons a short repair turns into a lost shift.
Three habits stop the leaks. Count a slice of the storeroom every week instead of once a year. Issue every part against a work order, so the cost lands on the machine that used it.
Then track supplier lead times and hold the long lead items yourself. A gearbox that takes 14 weeks to arrive belongs on your shelf, not on a promise.
Build a Culture That Rewards Prevention
Praise the breakdown that never happened.
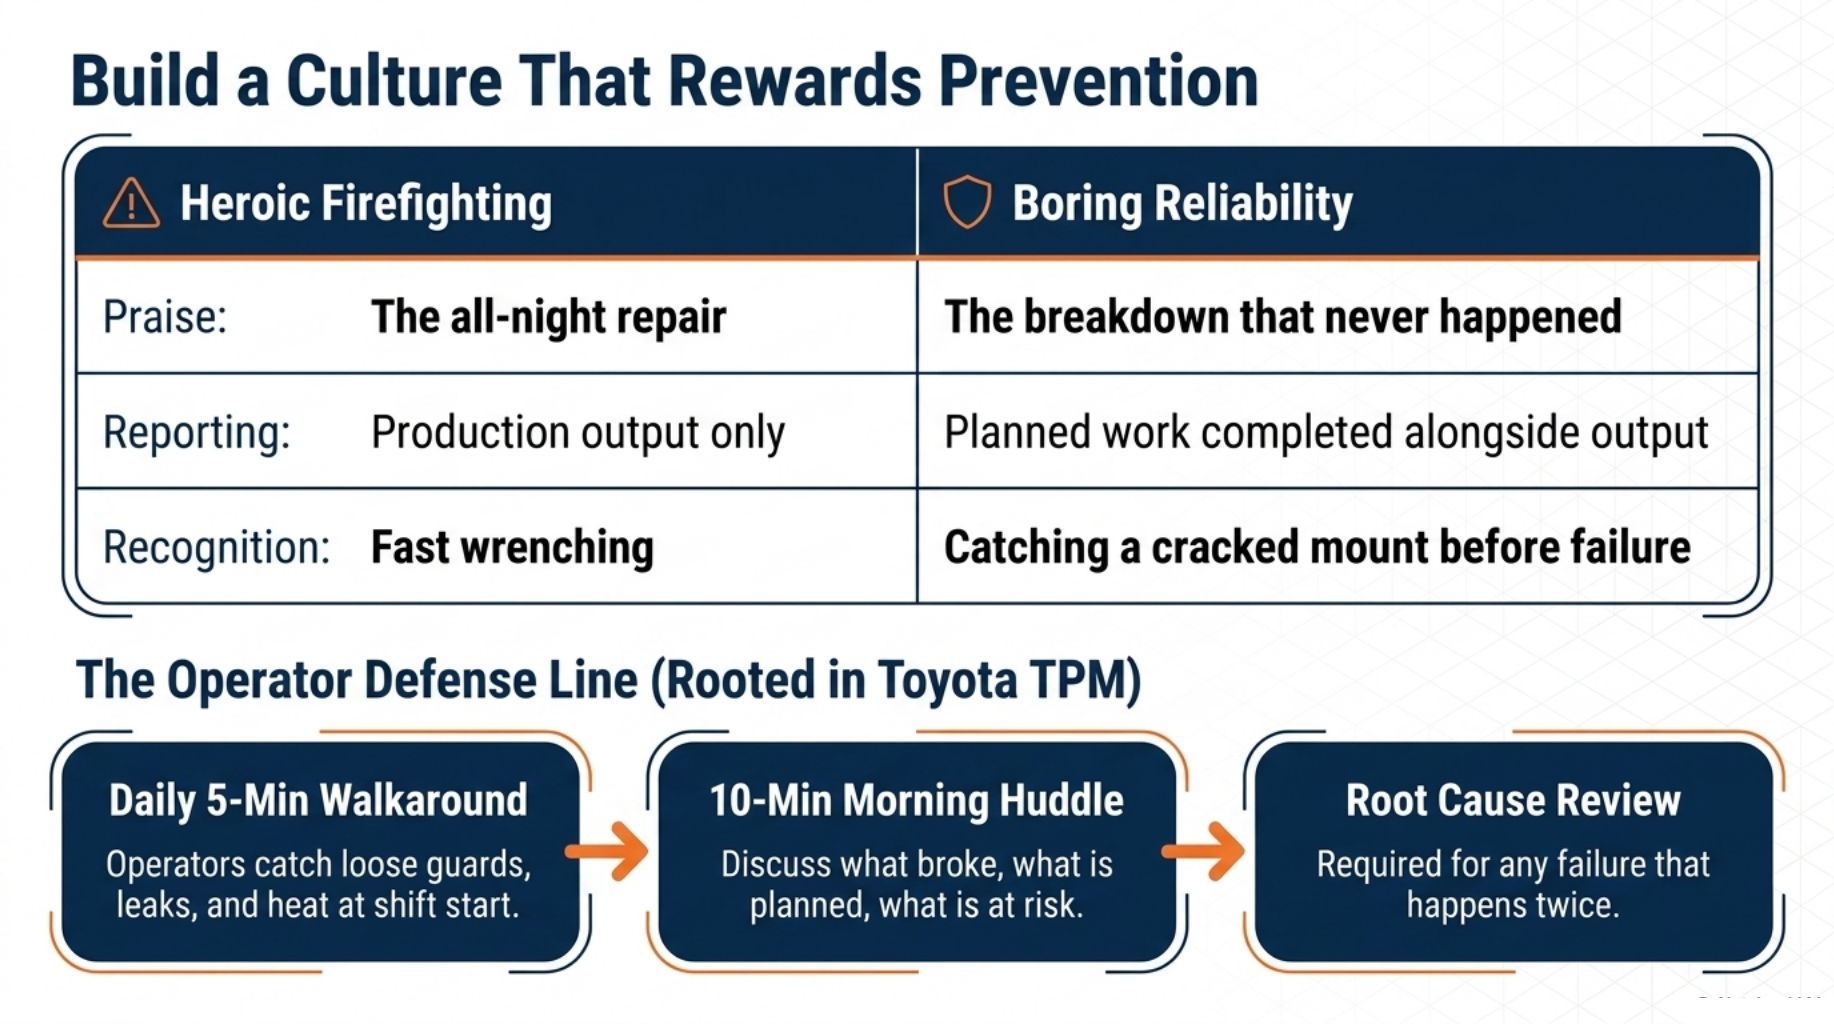
Culture follows what leaders measure. If the plant celebrates the technician who worked through the night, it will keep producing night work.
Change what gets praised. Report planned work completed in the same breath as production output. Name the inspection that caught a cracked mount before it failed.
Operators are your first line of defence. Total productive maintenance began at Nippondenso, a Toyota group supplier, where operators took on daily checks of their machines. A five-minute walk around at shift start catches loose guards, leaks, and heat long before a technician would see them.
Two habits keep it alive. Run a root cause review on any failure that happens twice, and give every action a name and a date. Hold a ten-minute huddle each morning on what broke, what is planned, and what is at risk.
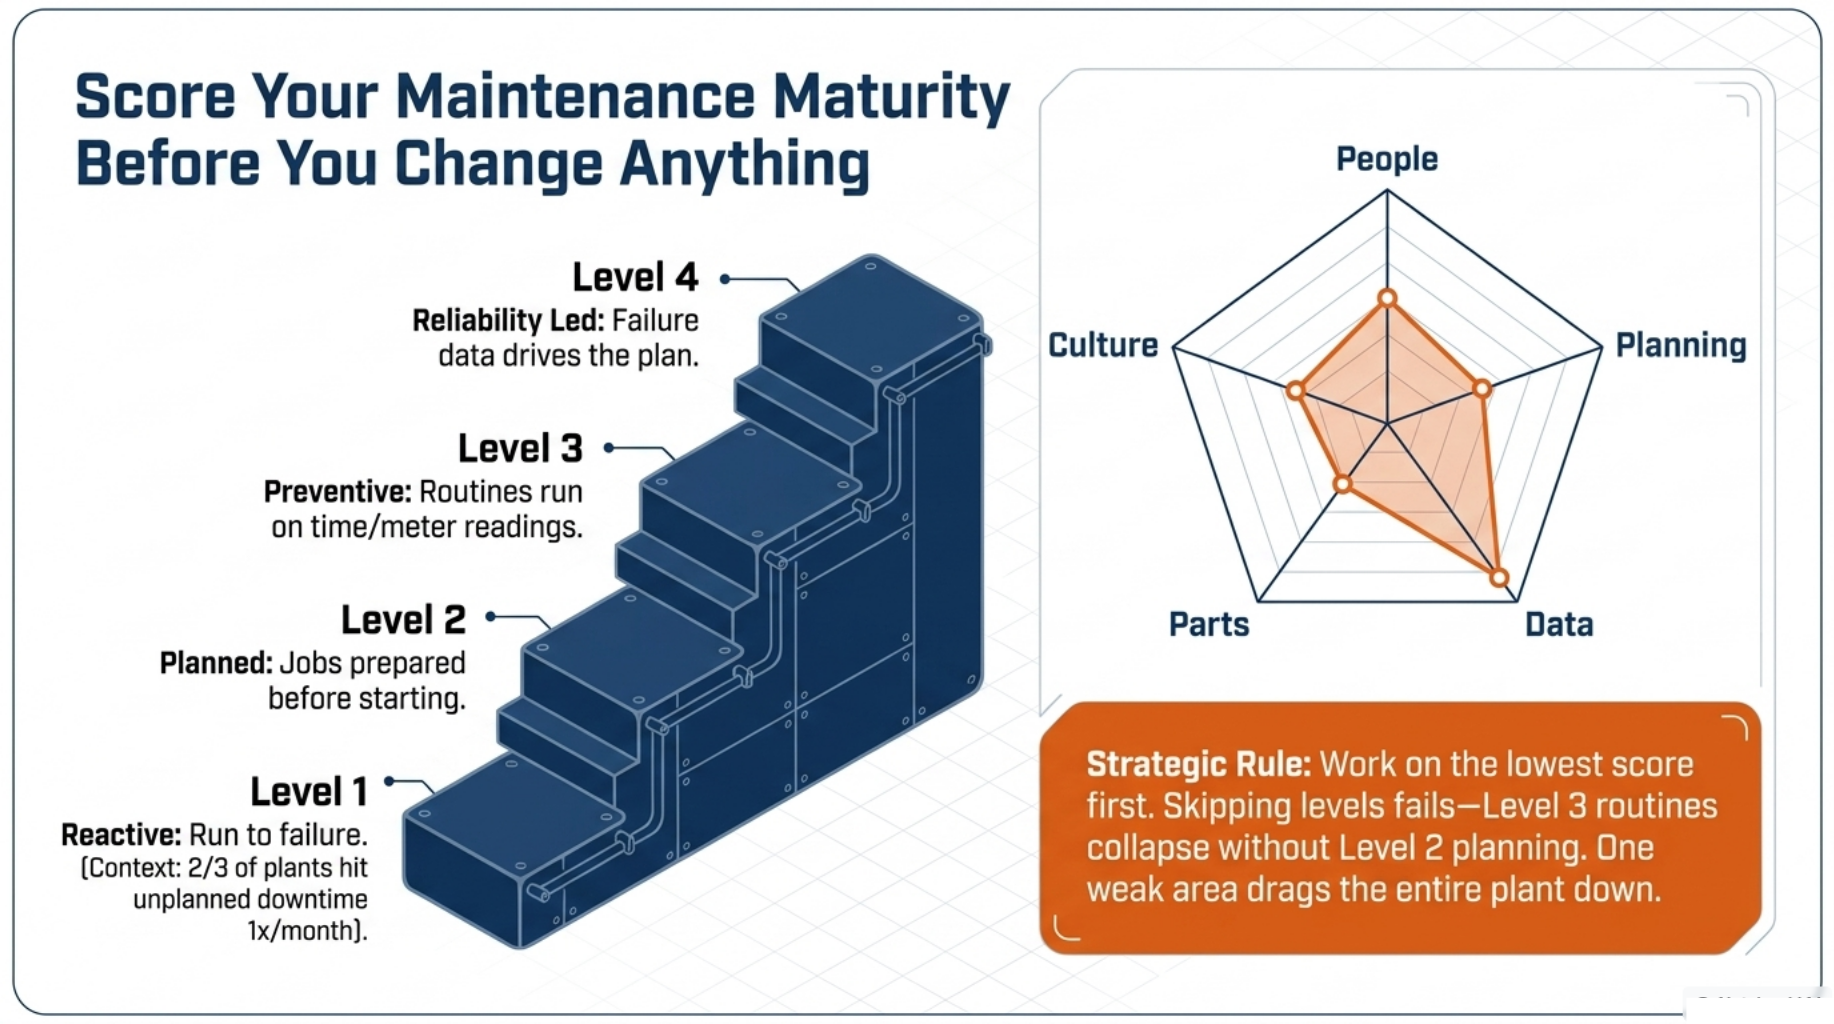
Score Your Maintenance Maturity Before You Change Anything
Know your level before you promise a result.
Use four levels. Level one is reactive, where the team runs machines to failure. Level two is planned, where jobs are prepared before they start. Level three is preventive, where routines run on time or meter readings. Level four is reliability led, where failure data drives the plan.
Score five areas out of four: people, planning, data, parts, and culture. Ten minutes with your supervisors gives you a first score.
Most plants find one area, drags the rest down. A plant can plan well and still sit at level one because the storeroom cannot supply the jobs.
Work on the lowest score first, then score again each quarter. Skipping a level rarely works because level three routines fall over without the planning built at level two.
There is plenty of room to move. Siemens and Senseye found that two thirds of plants surveyed hit unplanned downtime at least once a month.
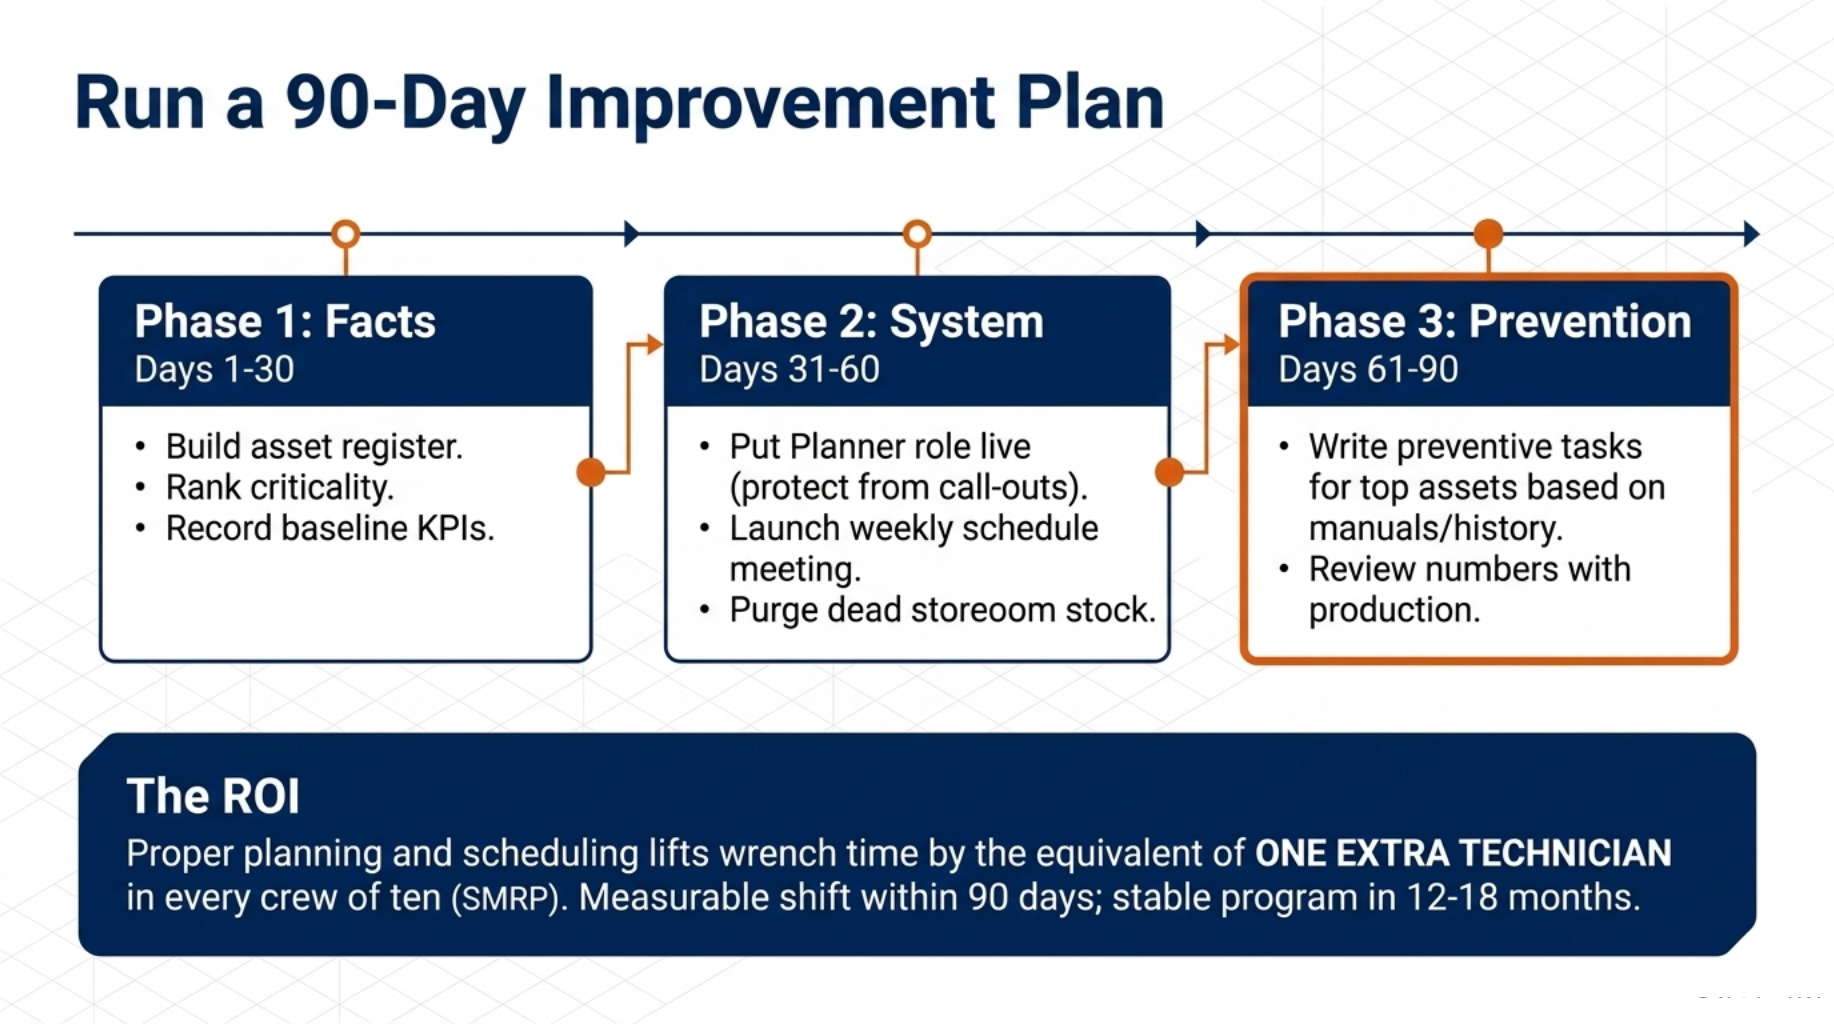
Run a 90-Day Improvement Plan
Ninety days is enough to move one level, not five.
Pick one goal per month. Give every action an owner and a date, or the plan turns into a wish list.
Days 1 to 30 are for facts. Build the asset register, rank assets by criticality, and record your baseline numbers. Without a baseline, you cannot prove anything later.
Days 31 to 60 are for the system. Put the planner role live and protect it from daily call-outs. Start the weekly schedule meeting. Clear the storeroom of stock tied to equipment you no longer run.
Days 61 to 90 are for prevention. Write preventive tasks for the top assets only, using the manuals and the failure history you now hold. Then review the numbers with production in the room.
Report the same five numbers every month. The prize is real: research cited by SMRP and by Ricky Smith at ReliablePlant shows that proper planning and scheduling can lift wrench time by the equivalent of one extra technician in every crew of ten.
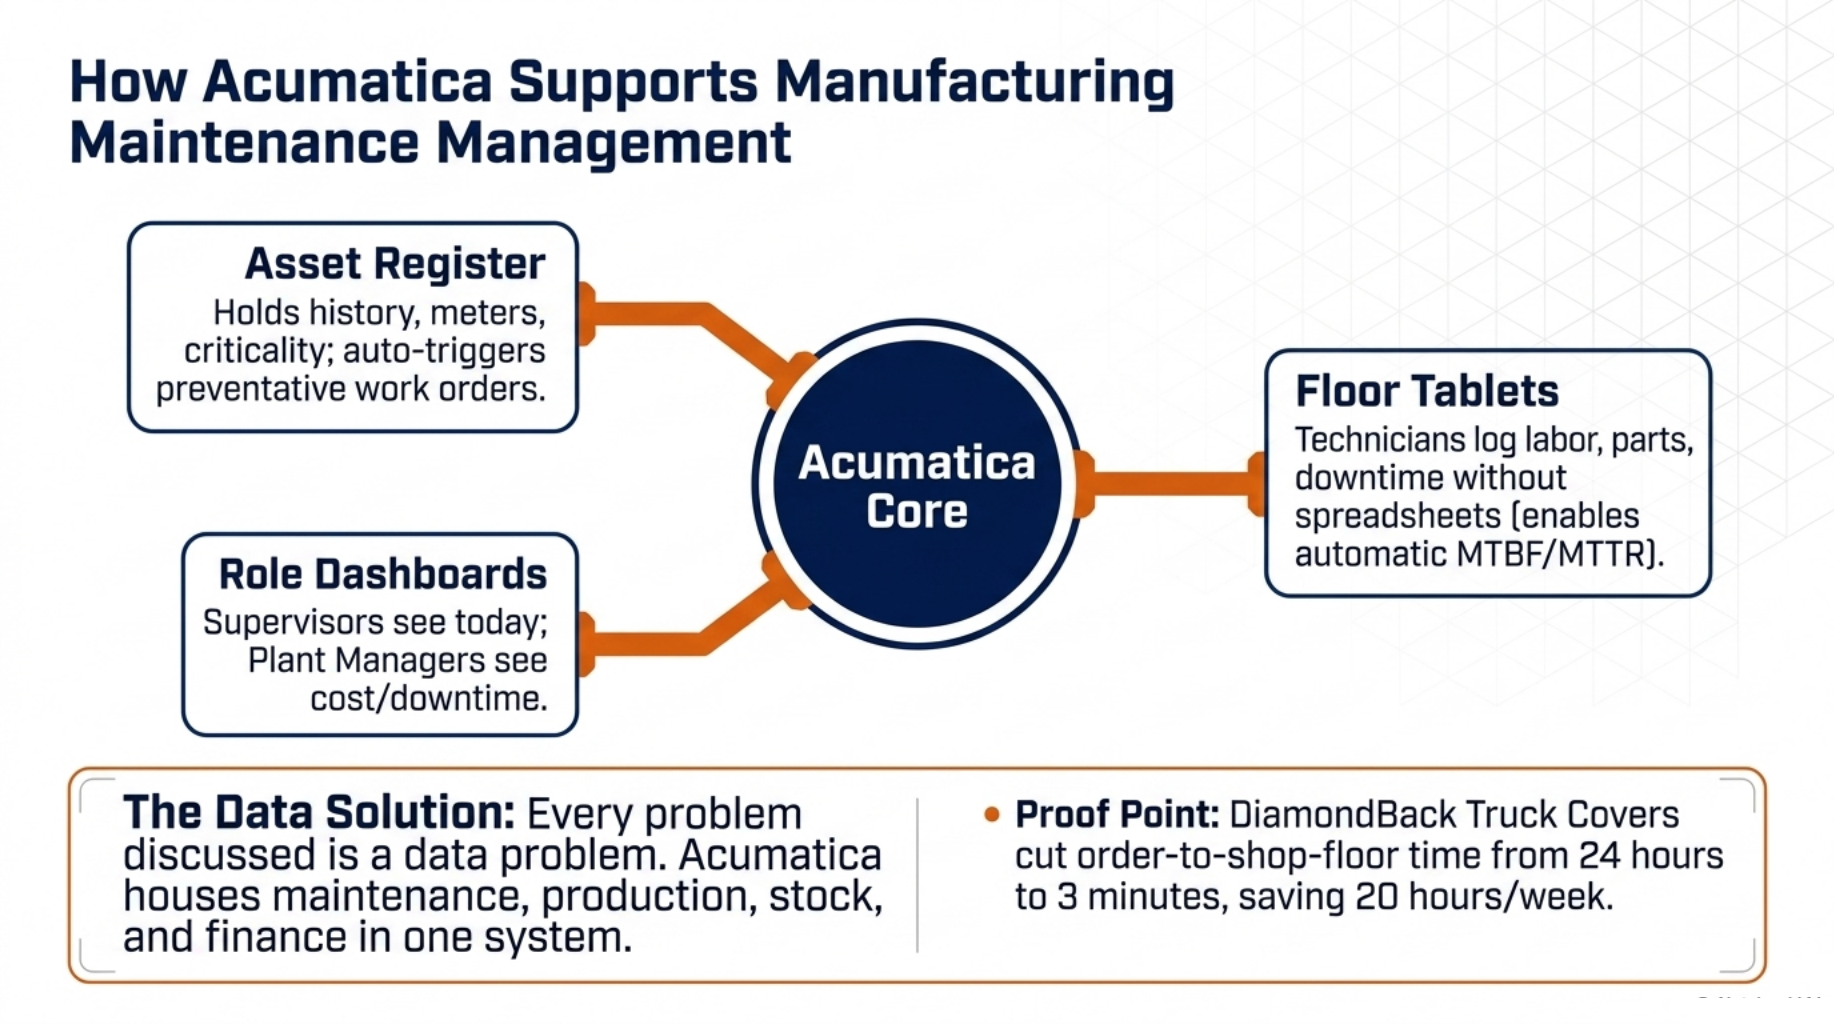
How Acumatica Supports Manufacturing Maintenance Management
One system for the asset, the work order, and the part.
Every problem above is a data problem. Acumatica handles manufacturing maintenance management inside the same system that runs production, stock, and finance.
The asset register holds history, meter readings, and criticality against each machine. Preventive schedules raise work orders by date or by meter reading, so the plan no longer depends on someone remembering.
Technicians log labour, parts, and downtime against the asset from a tablet on the floor. That one habit is what makes MTBF, MTTR, and planned maintenance percentage reportable without a spreadsheet.
Dashboards then show the numbers by role. The supervisor sees today’s jobs. The plant manager sees downtime by asset and cost by asset.
DiamondBack Truck Covers moved onto Acumatica Manufacturing Edition and cut the time for an order to reach the shop floor from over 24 hours to three minutes. The team also saved around 20 hours a week through automation and stopped running out of parts.
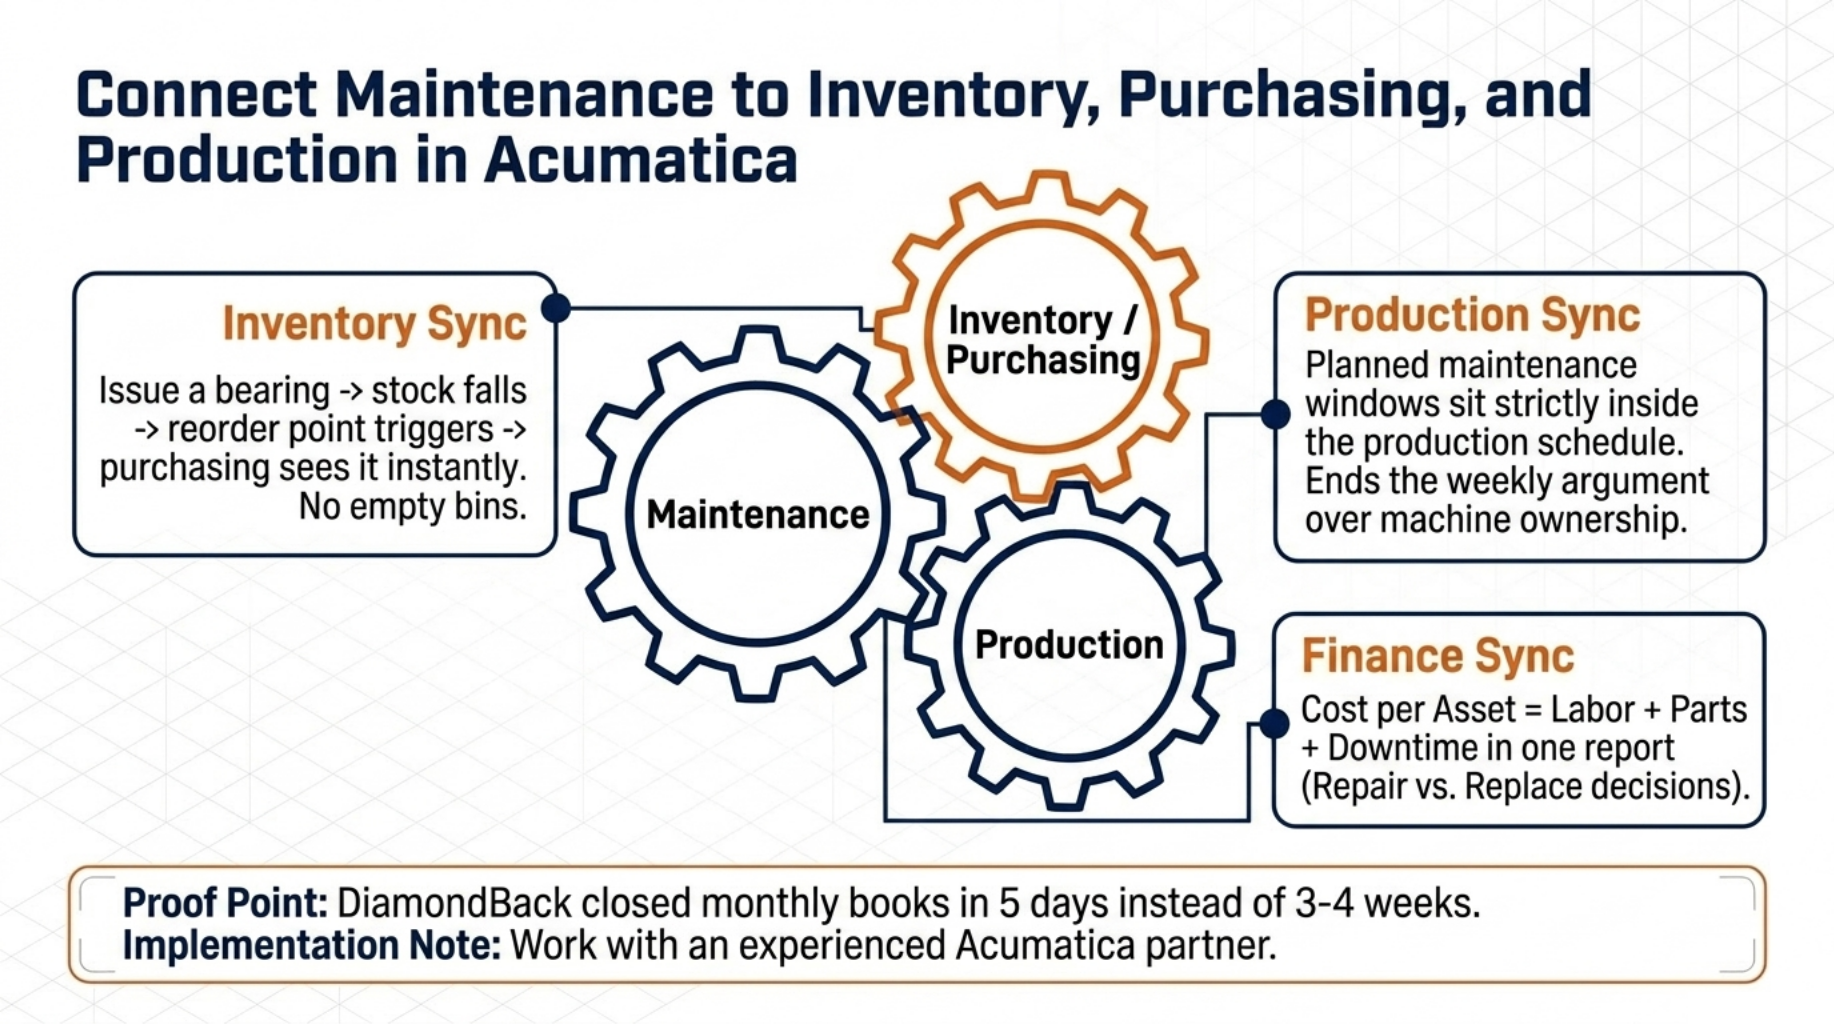
Connect Maintenance to Inventory, Purchasing, and Production in Acumatica
Maintenance stops being an island when the data is shared.
Most plants run maintenance in one place, stock in another, and production in a third. The handoffs are where jobs die. A part gets issued, nobody drops the stock count, and the next job finds an empty bin.
In Acumatica the work order and the stock record share the same data. Issue a bearing on a job and the stock level falls, the reorder point triggers, and purchasing sees the request.
Planned maintenance windows sit in the same schedule production works from. That takes away the weekly argument over who owns the line on Thursday.
Cost per asset becomes one report. Labour plus parts plus downtime against each machine tells you when to repair and when to replace.
DiamondBack also closed its monthly books in five days instead of three to four weeks after the move. Rollout is the part most plants underestimate, so work with an Acumatica partner who has taken a maintenance team through it before.

Wrapping Up
Manufacturing maintenance management improves when planning comes before reaction. Everything else follows that one shift.
Track a small set of numbers, led by planned maintenance percentage, so you can prove the plan is working. Then hold the gains with a clear team structure, a skills’ matrix that shows the real gaps, and a storeroom that supplies the jobs.
Score your plant, run 90 days, then score it again.
Book an Acumatica demo with Astraia to see maintenance, parts, and production working in one system.
FAQ
Q1: What is manufacturing maintenance management?
A: It is the practice of planning, scheduling, and tracking all work on plant equipment, so failures are prevented rather than chased.
Q2: What KPIs should a maintenance manager track?
A: Track planned maintenance percentage, schedule compliance, MTBF, MTTR, and backlog in crew weeks.
Q3: What is the difference between MTBF and MTTR?
A: MTBF measures the average run time between failures, while MTTR measures the average time taken to restore the asset.
Q4: How many technicians should one maintenance planner support?
A: Most reliability groups suggest one planner for every 15 to 20 technicians, adjusted for plant size and asset count.
Q5: How long does it take to move from reactive to planned maintenance?
A: Most plants see the first measurable shift within 90 days and a stable planned programme within 12 to 18 months.