




Summary
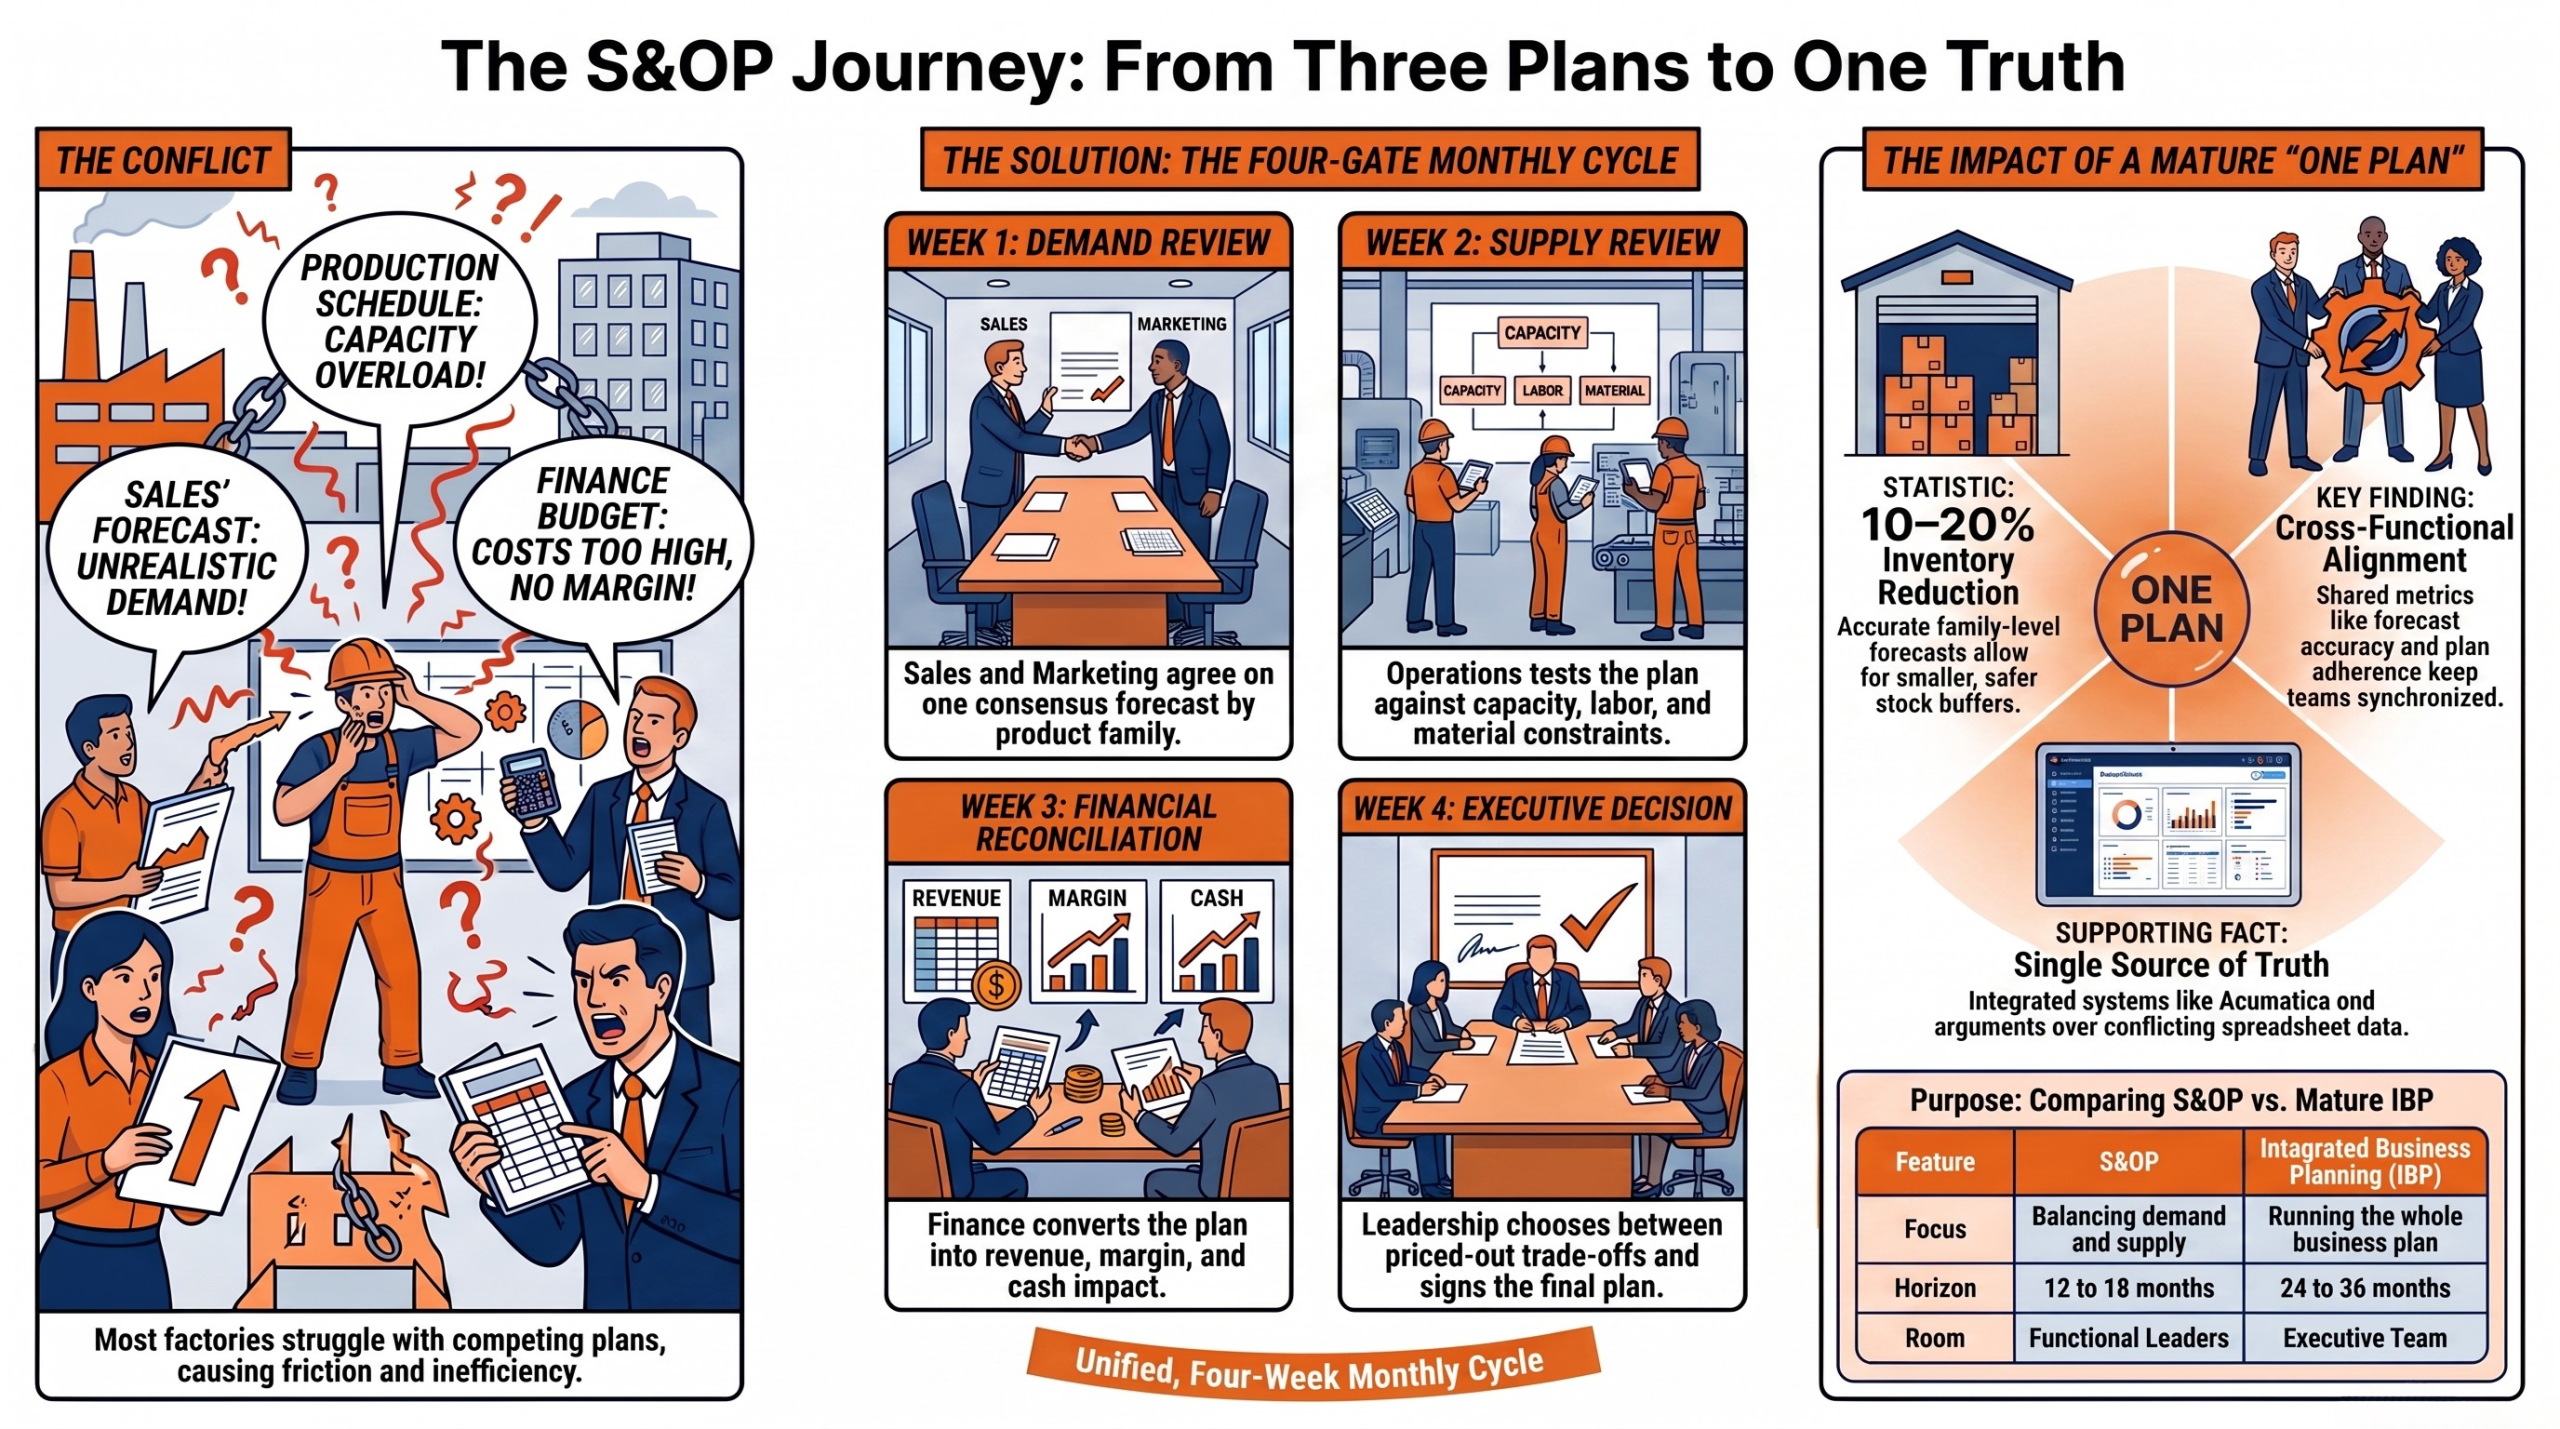
The article explains how ** Manufacturing Sales and Operations Planning (S&OP)** helps manufacturing teams replace conflicting sales, production, and finance plans with one agreed monthly plan. It outlines a four-step monthly cycle, common rollout mistakes, the benefits of mature S&OP, and how Acumatica supports the process with shared data and planning tools.
Key points
- S&OP means one plan, one number, one team: sales, operations, and finance align on a single 12–18 month plan.
- Monthly cycle has four gates: demand review, supply review, financial reconciliation, and executive decision meeting.
- Common failures include status-update meetings, planning at SKU level, weak executive sponsorship, and untrusted spreadsheet data.
- Mature S&OP improves service and cash flow by reducing inventory, premium freight, and forecast error.
- Acumatica supports S&OP by giving teams one shared system for demand, supply, finance, and executive decisions.
Introduction
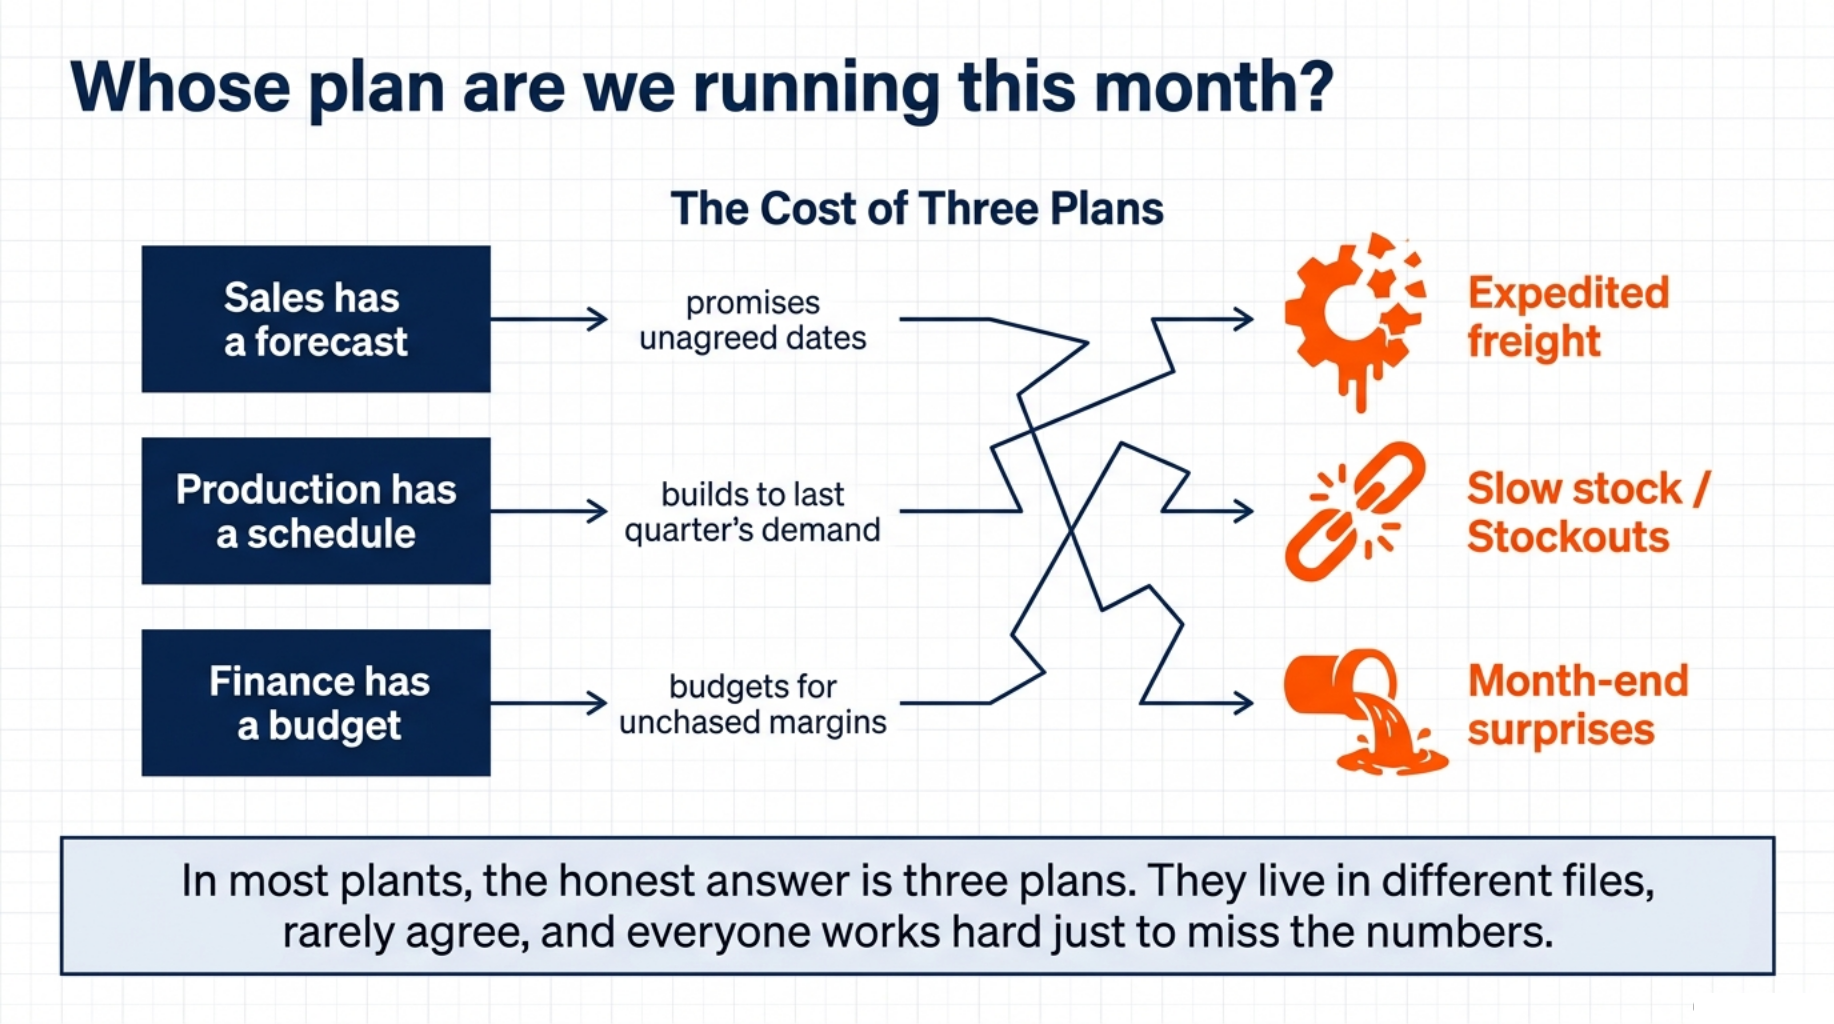
Manufacturing Sales and operations planning teams can trust starts with one blunt question: whose plan are we running this month? In most plants, the honest answer is three plans. Sales has a forecast. Production has a schedule. Finance has a budget.
The three live in different files and rarely agree. So the plant builds what it can, sales sells what it wants, and finance explains the gap after the fact. Everyone works hard. The numbers still miss.
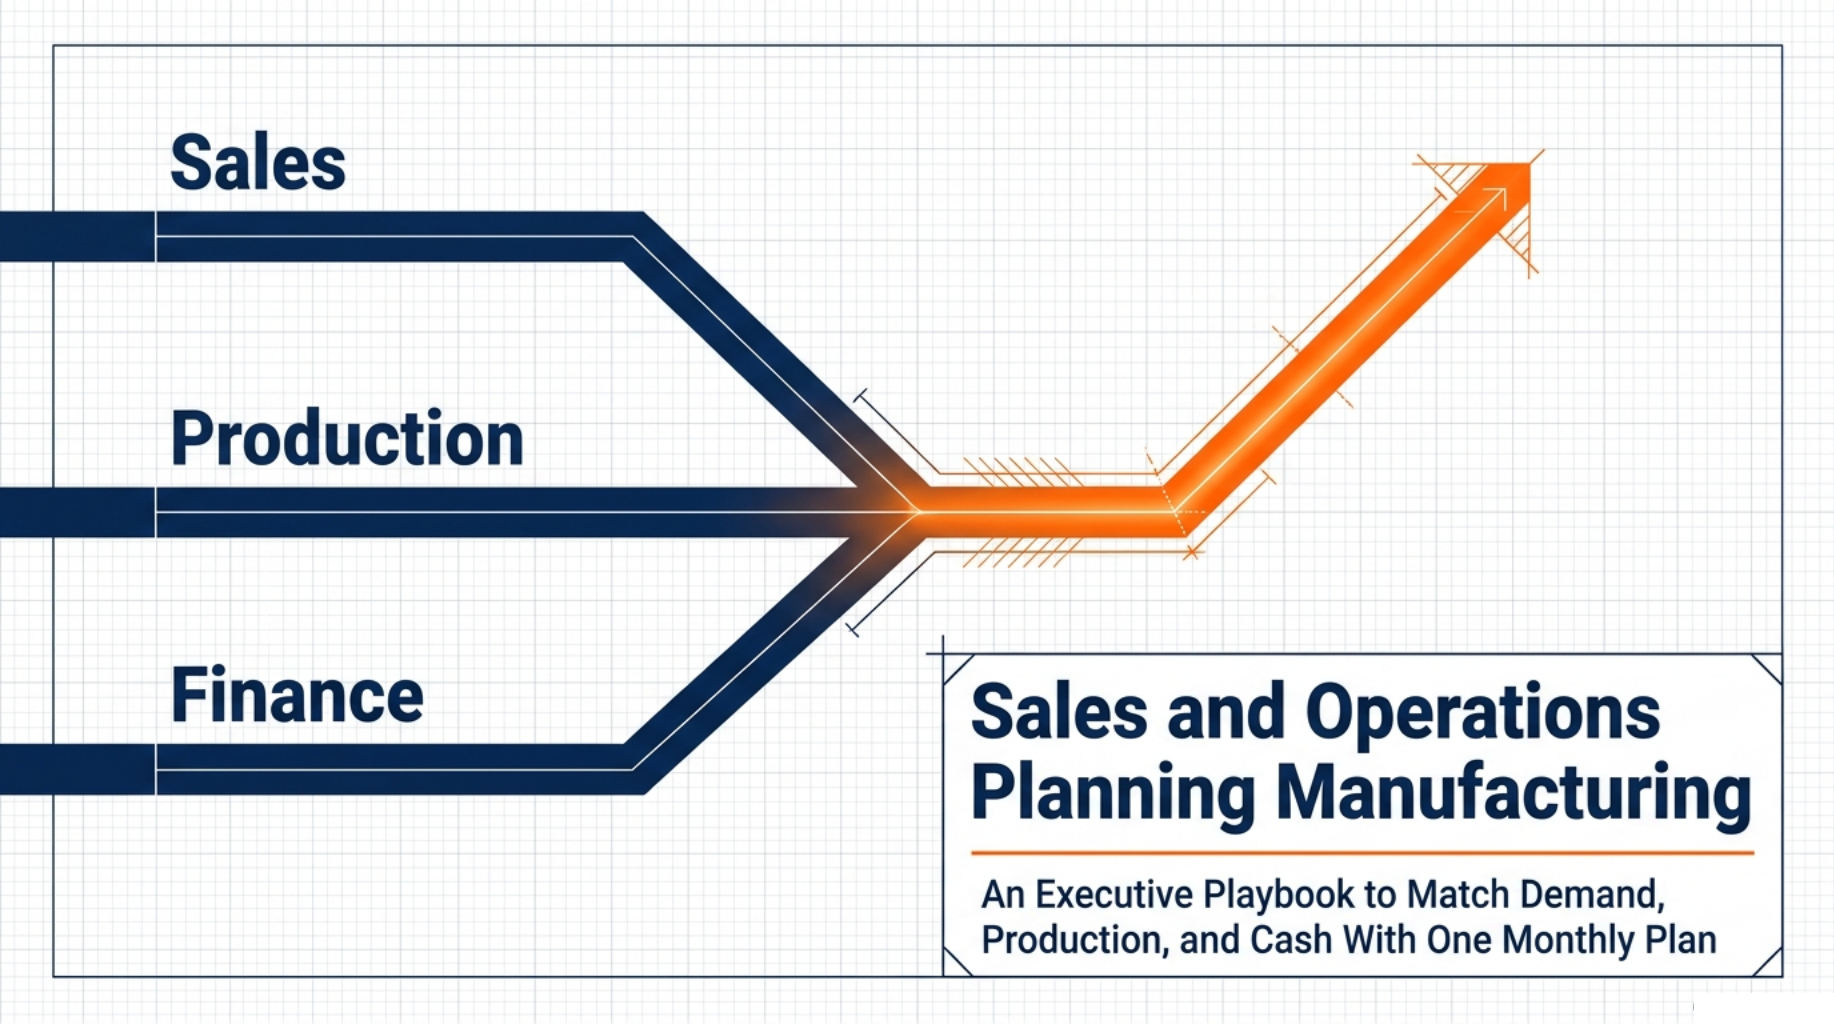
S&OP fixes that by forcing one plan, agreed once a month, that all three teams sign. It is not a new tool or a bigger spreadsheet. It is a rhythm. This guide walks through the monthly S&OP cycle step by step, the traps that kill most rollouts, and how the right system makes the whole thing stick.
What S&OP Really Means on a Factory Floor
“One plan. One number. One team.”
S&OP is a monthly process where sales, operations, and finance agree on a single plan for the next 12 to 18 months. That is the whole idea. Everything else is detail.
Think about what three competing plans cost you. Sales promises a delivery date the plant never agreed to. Production builds to a schedule based on last quarter’s demand. Finance budgets for a margin that neither team is chasing.
The result is familiar. Expedited freight to rescue a promise. Slow stock in one aisle and stockouts in the next. Month end surprises nobody planned for.
A working S&OP process balances what customers want against what the plant can build, and prices the gap in cash. It runs on a fixed calendar, not on panic. Crisis meetings are a symptom of no process, not a substitute for one.
The most important test is simple. If your monthly meeting ends with a slide deck and no decision, you do not have S&OP yet. The output must be a choice: build it, delay it, price it, or say no.
Formal S&OP is still less common than you would expect. Bodies such as ASCM and Oliver Wight, who helped shape the discipline, both report that only a small share of manufacturers reach full process maturity. That gap is the opportunity.
So what does the cycle actually look like month to month?
The Monthly S&OP Cycle Step by Step
“A plan built once a month beats a plan rebuilt every day.”
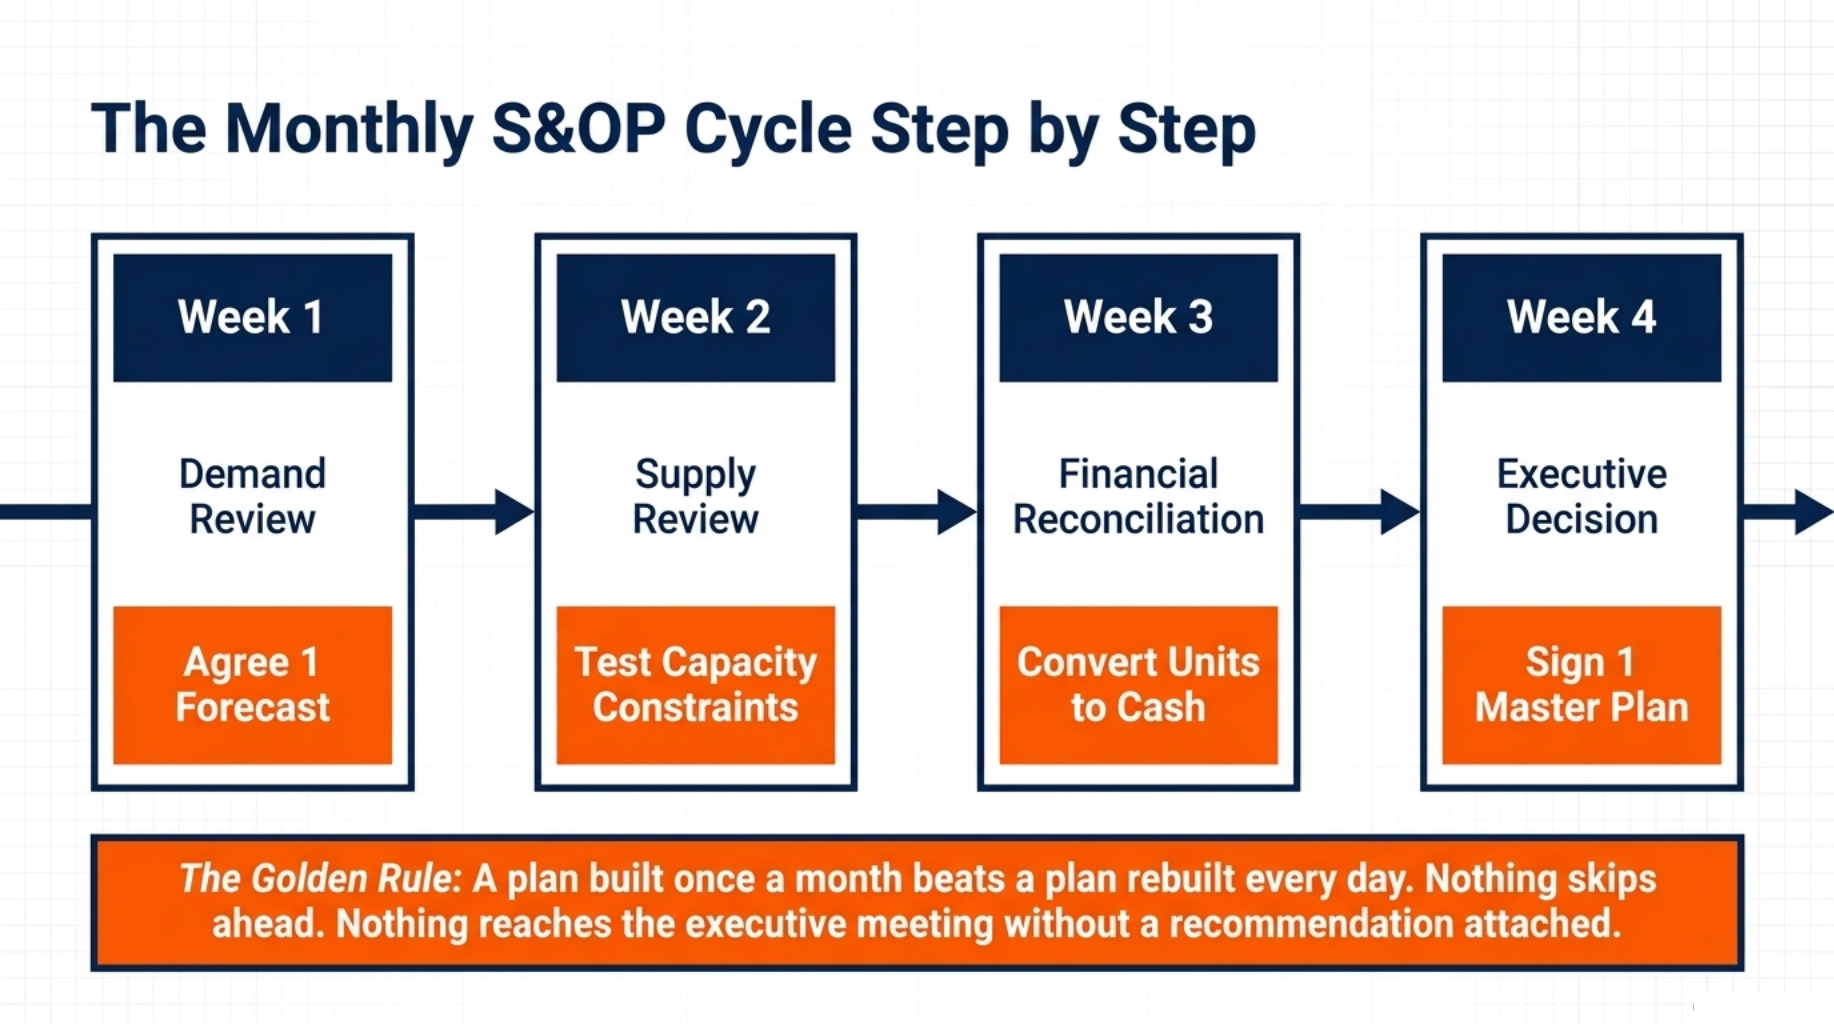
The cycle has four gates. Each one has an owner, a fixed slot in the month, and an output the next gate depends on. Nothing skips ahead.
Set the calendar once and protect it. Gate one in week one, gate four in week four, every month, no exceptions. Planners who run a full cycle for two or three quarters usually see forecast accuracy climb before they change any software.
The rule that matters most: nothing reaches the executive meeting without a recommendation attached.
Step 1: Demand Review
Week one belongs to demand. Sales, marketing, and demand planning sit down and agree one consensus forecast. Not three views. One.
Split the number into parts you can defend. Base demand is what the market buys without help. On top of that sit promotions, new product launches and one off orders that will not repeat.
That split matters because each part behaves differently. A promotion spike copied into next year’s base plan is how phantom demand gets built into a schedule.
Track accuracy by product family, not by single SKU. Planners have long noted that family level forecasts land far closer than item level ones because errors cancel across similar products. Picture a pump maker with 400 SKUs and eight families. Eight numbers can be argued about. Four hundred cannot.
Step 2: Supply Review
Week two tests the demand plan against reality. Operations checks machine capacity, labour, tooling, and material supply. The question is short: can we build this?
Where the answer is no, flag the constraint with a fix and a cost. “Line 3 is over capacity in March” is a red mark. “Line 3 is over capacity in March, a weekend shift closes the gap for R180k, or we pull 2,000 units into February” is a decision.
Set inventory targets by family in the same session. Safety stock should follow demand variability and lead time, not habit.
A useful discipline here is to name the longest lead item in each family. Picture a valve manufacturer whose castings take 14 weeks. Its supply review has to look at least four months out, or the plan is fiction.
Step 3: Financial Reconciliation
Week three turns units into money. Take the agreed volumes and convert them to revenue, margin, and cash. This is where the plan stops being an operations document.
Compare the result against budget and show the gap without softening it. If the plan lands 6 per cent under budget on revenue, say so in week three, not at year-end.
Bring finance in as a planner, not a scorekeeper. There is a real difference between a finance team that grades the plan afterwards and one that helps shape it while there is still time to act.
Cash is the number of executives reacts to fastest. Show what the plan locks up in raw material and finished goods, and the room wakes up.
Step 4: Executive Decision Meeting
Week four is short by design. Bring two or three real choices, each with the trade-off priced out. No status updates.
A good agenda item sounds like this: demand for the pump family is up 15 per cent, we can meet it with a weekend shift, we can meet part of it and quote longer lead times, or we can hold price and let the backlog grow. Pick one.
The meeting ends when one plan is signed and every department agrees to run it. Assign owners and dates before anyone leaves the room.
That plan is now the only plan. Sales quotes from it. The plant schedules from it. Finance forecasts from it.
Knowing the steps is the easy part. Making them survive contact with a busy month is where most programmes fall over.
Common Pitfalls That Sink an S&OP Rollout
“S&OP dies when it turns into a status update.”
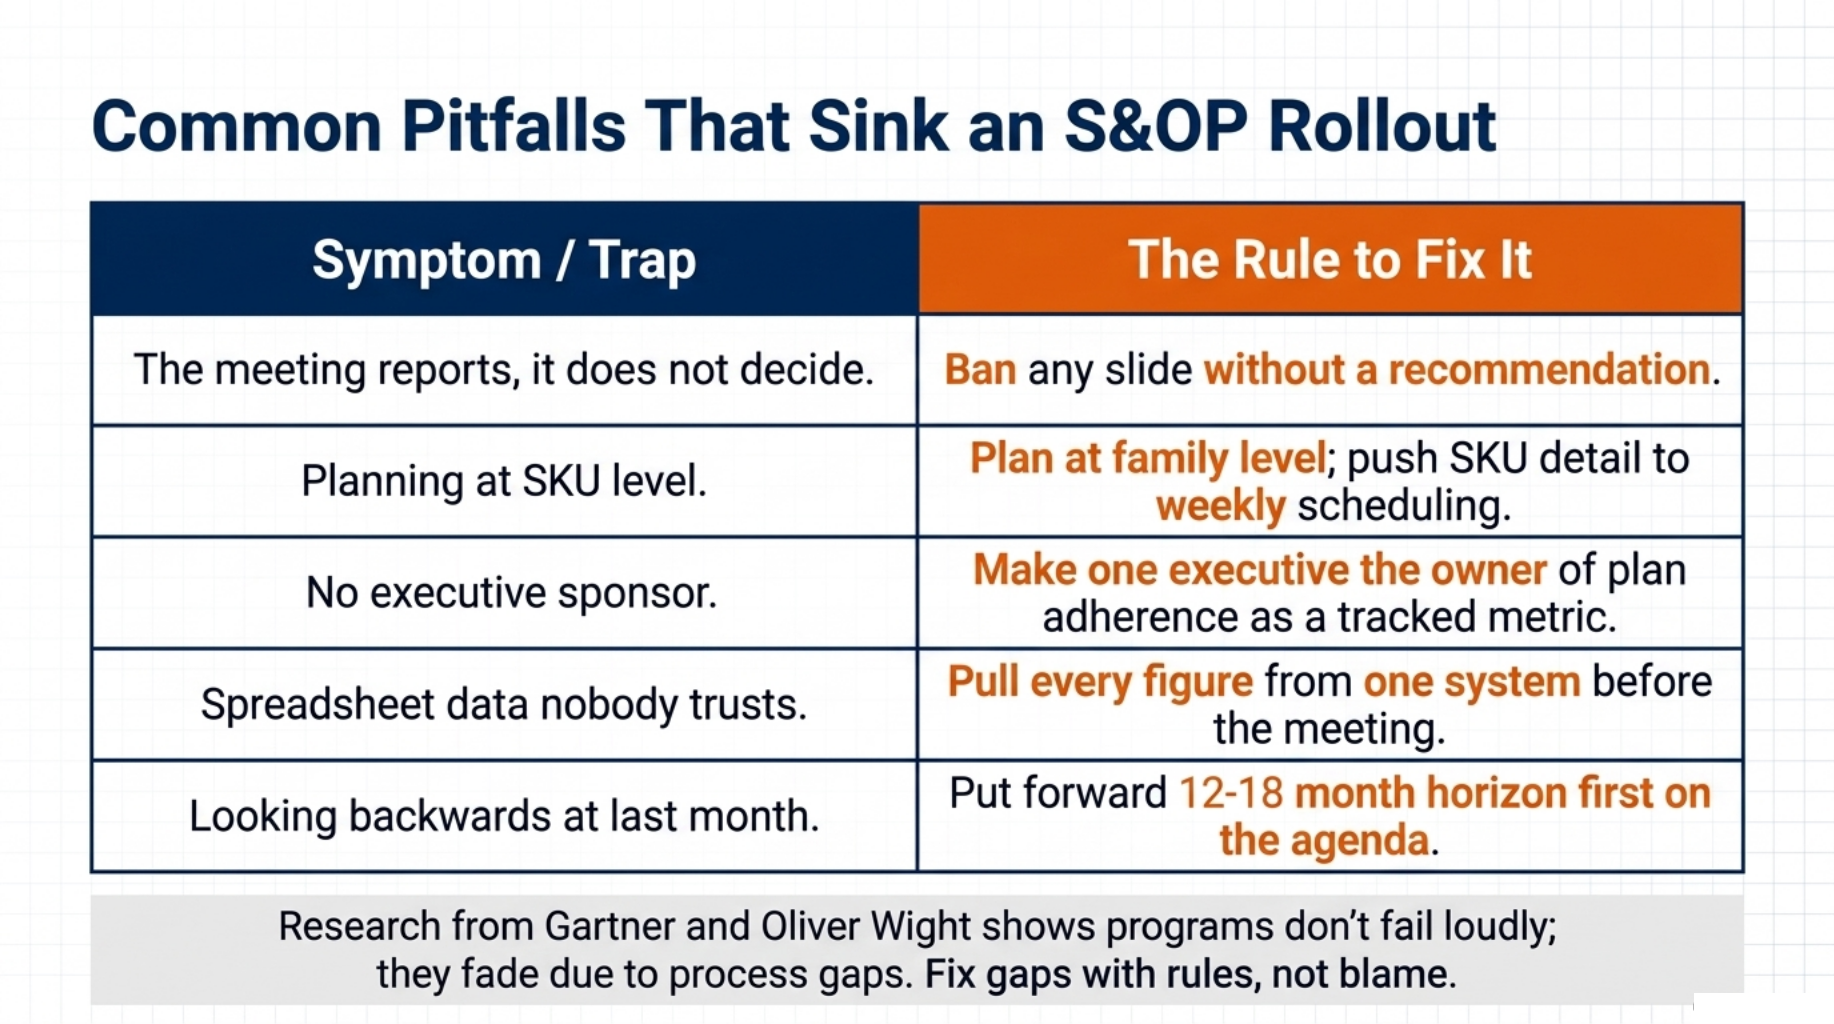
Most S&OP programmes do not fail loudly. They fade. Research from consultancies such as Oliver Wight and Gartner points the same way: a large share of programmes stall before they reach maturity, and the reasons repeat.
Here are the five that do the most damage, and what to do about each.
- The meeting reports, it does not decide. Everyone presents. Nobody chooses. Fix it by banning any slide that does not carry a recommendation.
- Planning at SKU level. The team drowns in 800 rows and argues about noise. Fix it by planning at family level and pushing SKU detail down to weekly scheduling.
- No executive sponsor. Sign off happens, then a big customer calls and the plan is quietly ignored. Fix it by making one executive the owner of plan adherence as a tracked metric.
- Spreadsheet data nobody trusts. The first 30 minutes go to arguing about whose numbers are right. Fix it by pulling every figure from one system before the meeting starts.
- Looking backwards. The team reviews last month instead of the next 12 to 18 months. Fix it by putting the forward horizon first on the agenda and last month’s variance last.
None of these are one department’s fault. They are process gaps, and process gaps get fixed with rules, not blame.
Fixing the process only holds if the people in the room want the same thing.
How to Win Cross-Functional Alignment
“Alignment is a habit, not a workshop.”
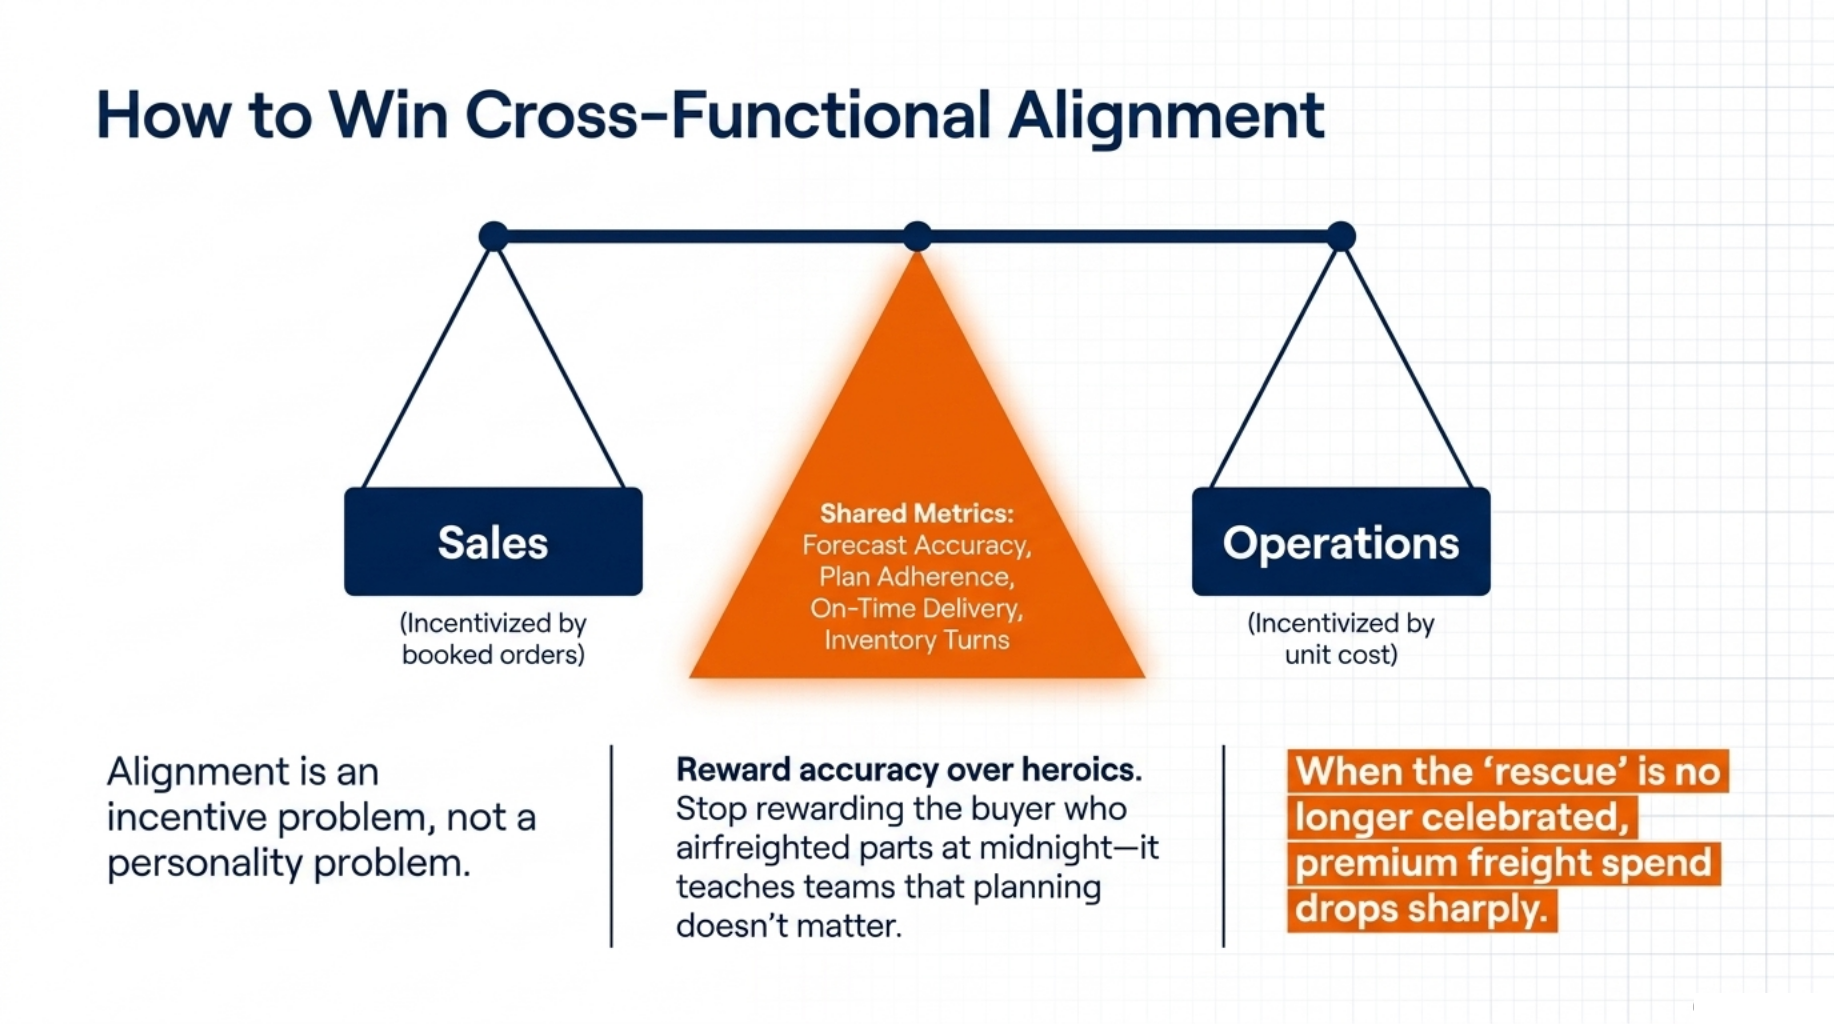
Alignment is not a personality problem. It is an incentive problem. If sales is paid on booked orders and operations is measured on unit cost, they will pull against each other every month, however friendly the meeting is.
Start with shared metrics. Forecast accuracy, plan adherence, on time delivery and inventory turns should appear on both scorecards. When one team wins and the other loses, the plan breaks.
Name the roles that must attend. Demand review needs sales leadership, marketing, and demand planning. Supply review requires production, procurement, and materials. The executive meeting requires the people who can approve spend.
Then protect the calendar. A meeting that slips twice stops being a rhythm and becomes an event.
Publish the plan and the assumptions behind it. If sales can see why the plant said no, the next conversation starts from facts.
Reward accuracy over heroics. A firm that celebrates the buyer who airfreighted parts at midnight is teaching everyone that planning does not matter. Consultancies working with mid-sized manufacturers report that expedite and premium freight spend often drops sharply once teams stop rewarding the rescue.
Start with one product family. Prove the value, then scale.
Once the rhythm holds, a question comes up in most boardrooms: should we be doing something bigger?
S&OP vs Integrated Business Planning
“IBP is S&OP with strategy in the room.”
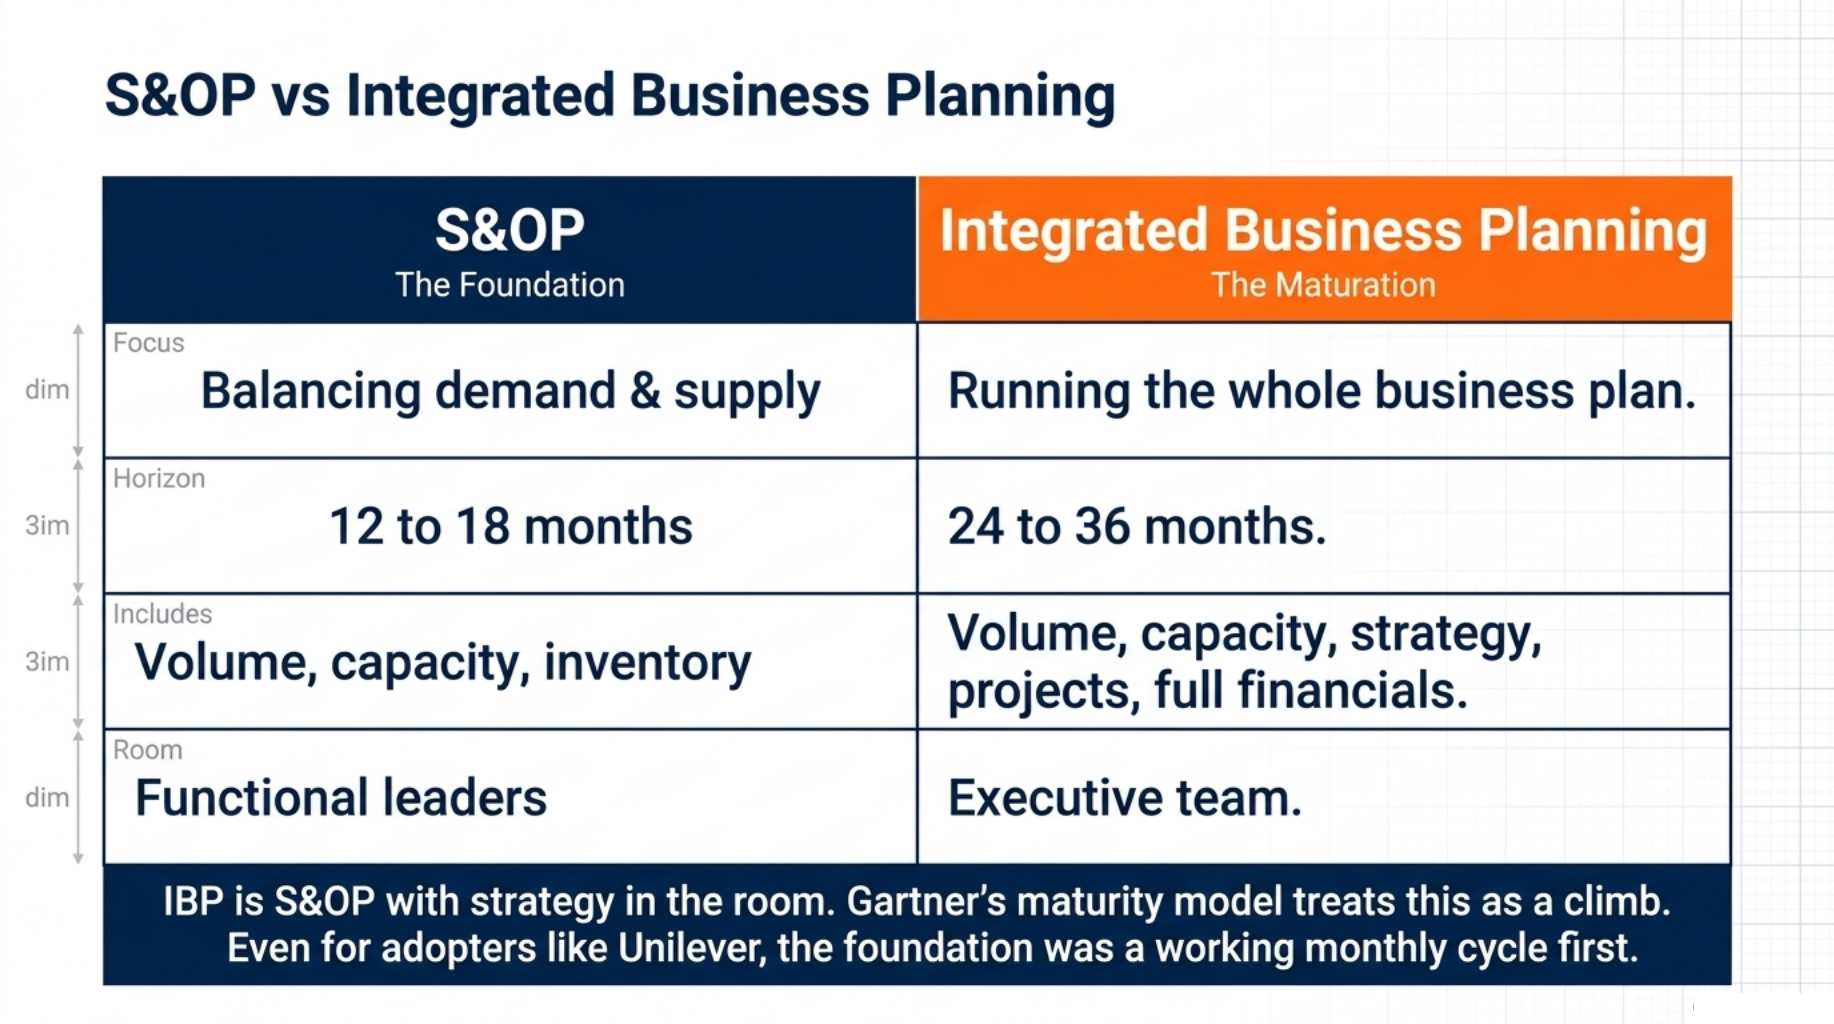
Integrated business planning is S&OP grown up. Same rhythm, wider scope, more senior room. That is the honest short answer.
Here is the practical difference:
| S&OP | Integrated business planning | |
|---|---|---|
| Focus | Balancing demand and supply | Running the whole business plan |
| Horizon | 12 to 18 months | 24 to 36 months |
| Includes | Volume, capacity, inventory | Volume, capacity, strategy, projects, full financials |
| Room | Functional leaders | Executive team |
Gartner’s demand-driven maturity model treats this as a climb, not a switch. Most manufacturers sit in the middle stages, and the jump to full IBP is a maturity step rather than a software purchase.
Unilever is one of the best documented adopters of IBP at scale, and even there the foundation was a working monthly cycle first.
The advice for most plants is simple. Master the four gate S&OP cycle. Get the data trusted. Then stretch the horizon and add strategy.
The payoff for getting this right shows up in two places every executive watches.
What Mature S&OP Does to Working Capital and Service
“Better plans free cash without cutting a single order.”
The two headline results are lower working capital and higher service levels. They sound like opposites. They are not, and the mechanism explains why.
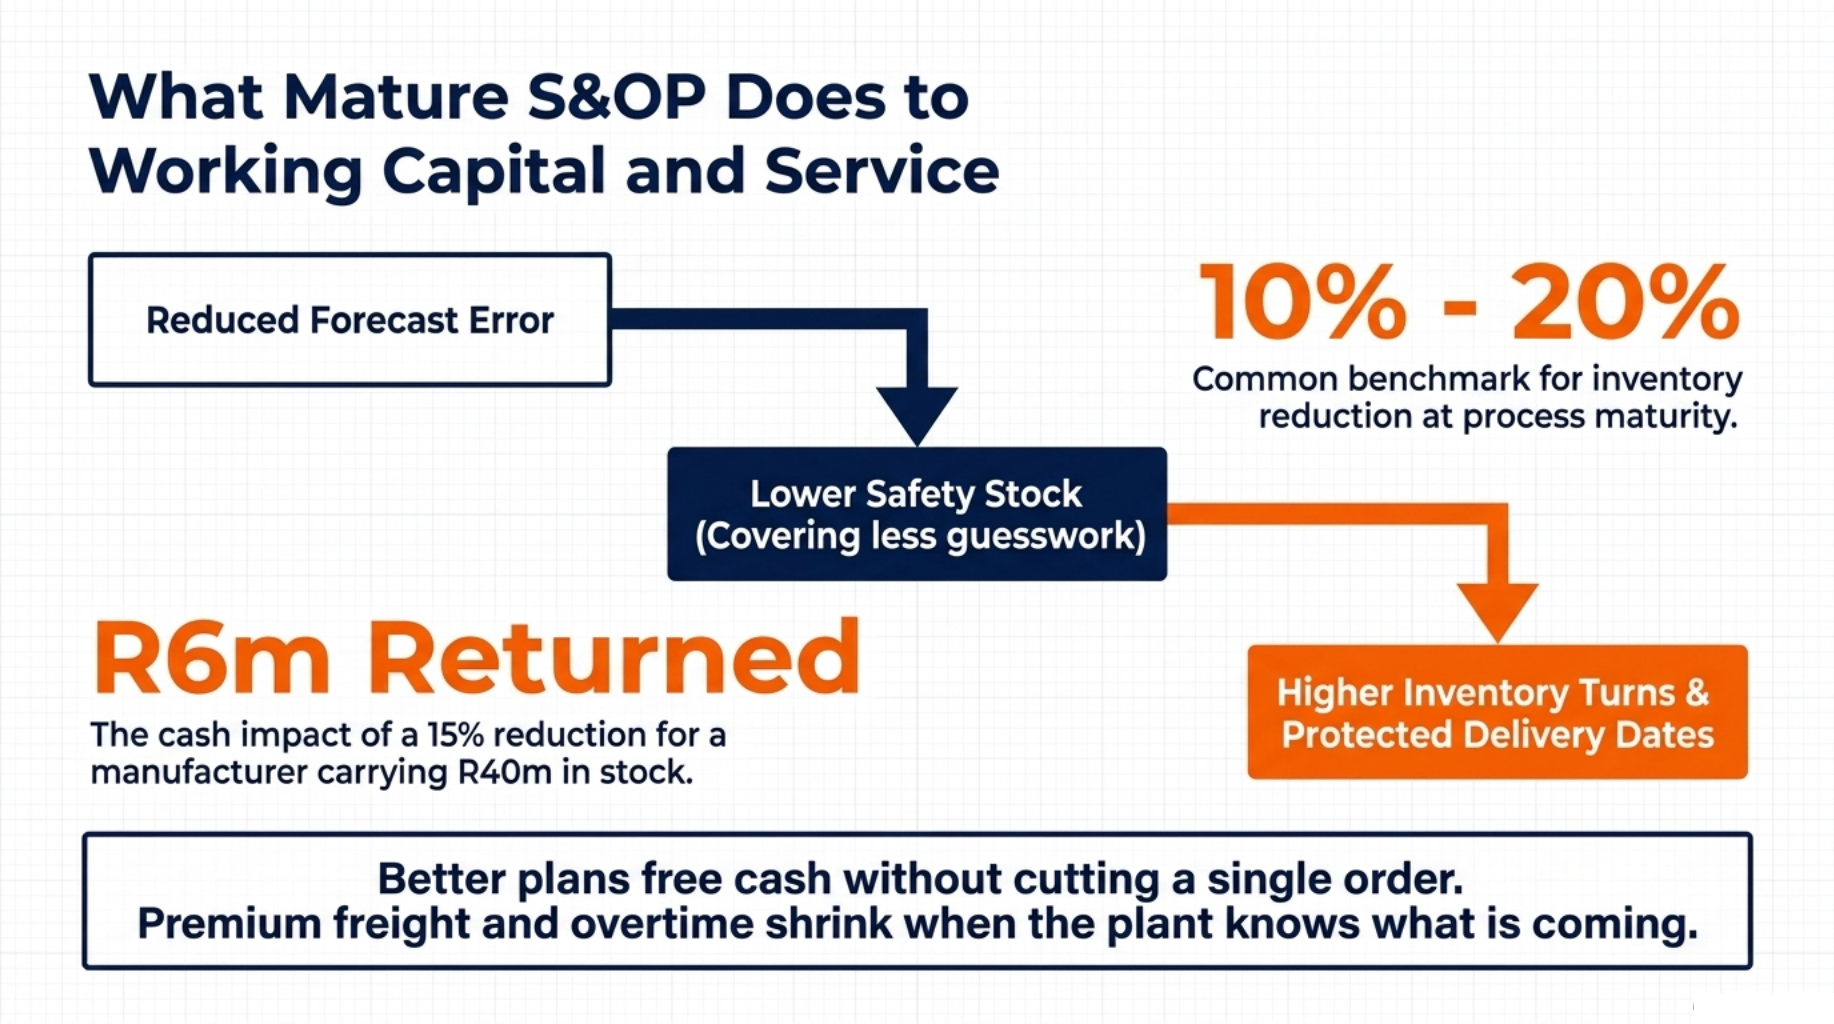
Safety stock exists to cover forecast error and supply variability. Cut the error, and you can cut the buffer without cutting service. That is the whole trick.
Sharper family level forecasts mean less stock covering guesswork, which lifts inventory turns. Benchmark ranges published by supply chain research groups commonly land near 10 to 20 percent inventory reduction for firms that reach process maturity.
Fewer surprises also cut the expensive fixes. Premium freight, overtime, and short run changeovers all shrink when the plant knows what is coming.
Booked capacity protects delivery dates. When the plant has agreed the volume three months out, sales can quote a date it will actually hit.
And cash locked in raw material and finished goods comes back to the business. For a manufacturer carrying R40m of stock, a 15 per cent reduction is R6m returned. That is the number that gets a CFO’s attention.
None of this holds together if the numbers come from four different spreadsheets.
How Acumatica Supports the S&OP Process
“One system of record ends the spreadsheet argument.”
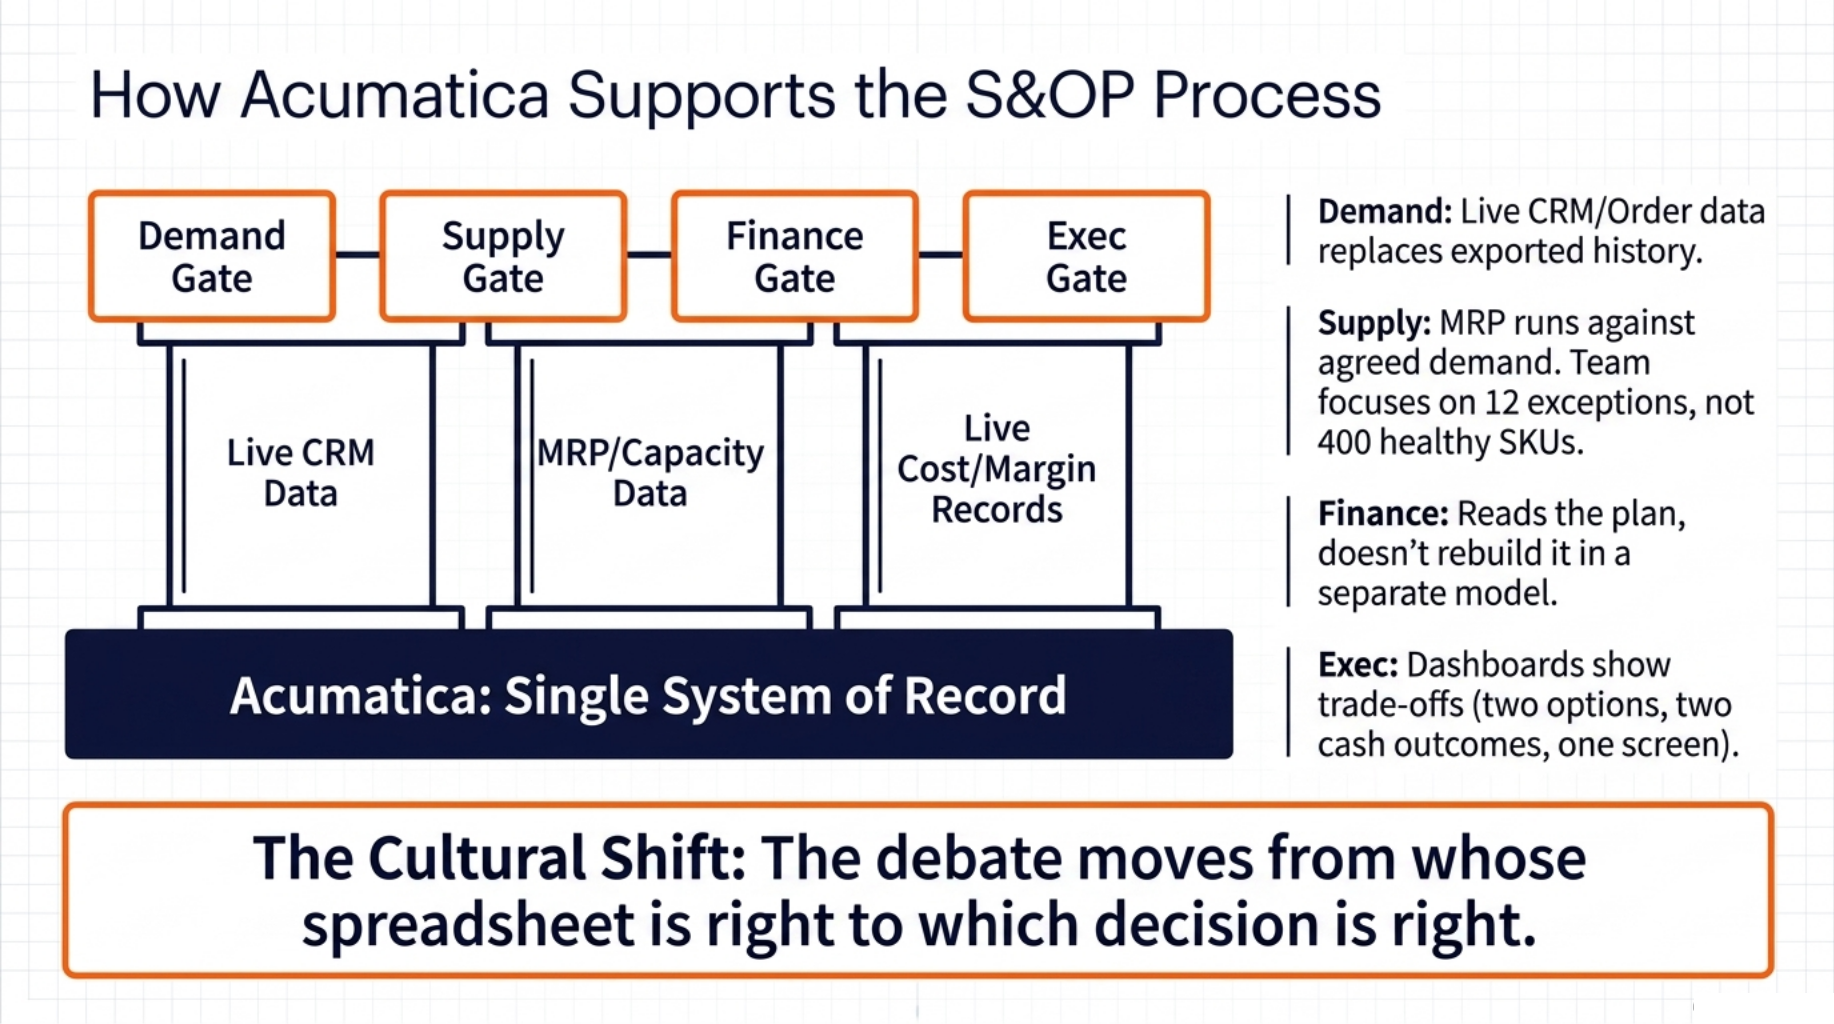
Acumatica gives every gate in the cycle one shared set of data. Map it stages by stage and the fit is clear.
Demand review. Sales history, open pipeline and forecast tools sit in the same system. Because CRM and order data live alongside inventory, the consensus forecast is built from live numbers rather than an export sent last Tuesday.
Supply review. Material requirements planning, capacity planning and production scheduling run against the agreed demand plan. Constraints surface as exceptions, so the team spends the meeting on the 12 problem items instead of scrolling through 400 healthy ones.
Financial reconciliation. Cost, margin, and cash views tie back to the same records. Finance is not rebuilding the plan in a separate model. It is reading the plan.
Executive meeting. Dashboards and scenario views put the trade-offs side by side. Two options, two cash outcomes, one screen.
The wider point is cultural. When everyone pulls from one system of record, nobody can win an argument by producing a different spreadsheet. The debate moves from whose numbers are right to which decision is right.
Acumatica publishes customer stories from manufacturers who report lower inventory and faster order turnaround after replacing spreadsheet planning with connected data. Worth reading before you scope your rollout.
If that sounds like where you want to be, the first steps are smaller than most teams expect.
Getting Started With Acumatica for Manufacturing Planning
“Start with one product family. Prove it. Then scale.”
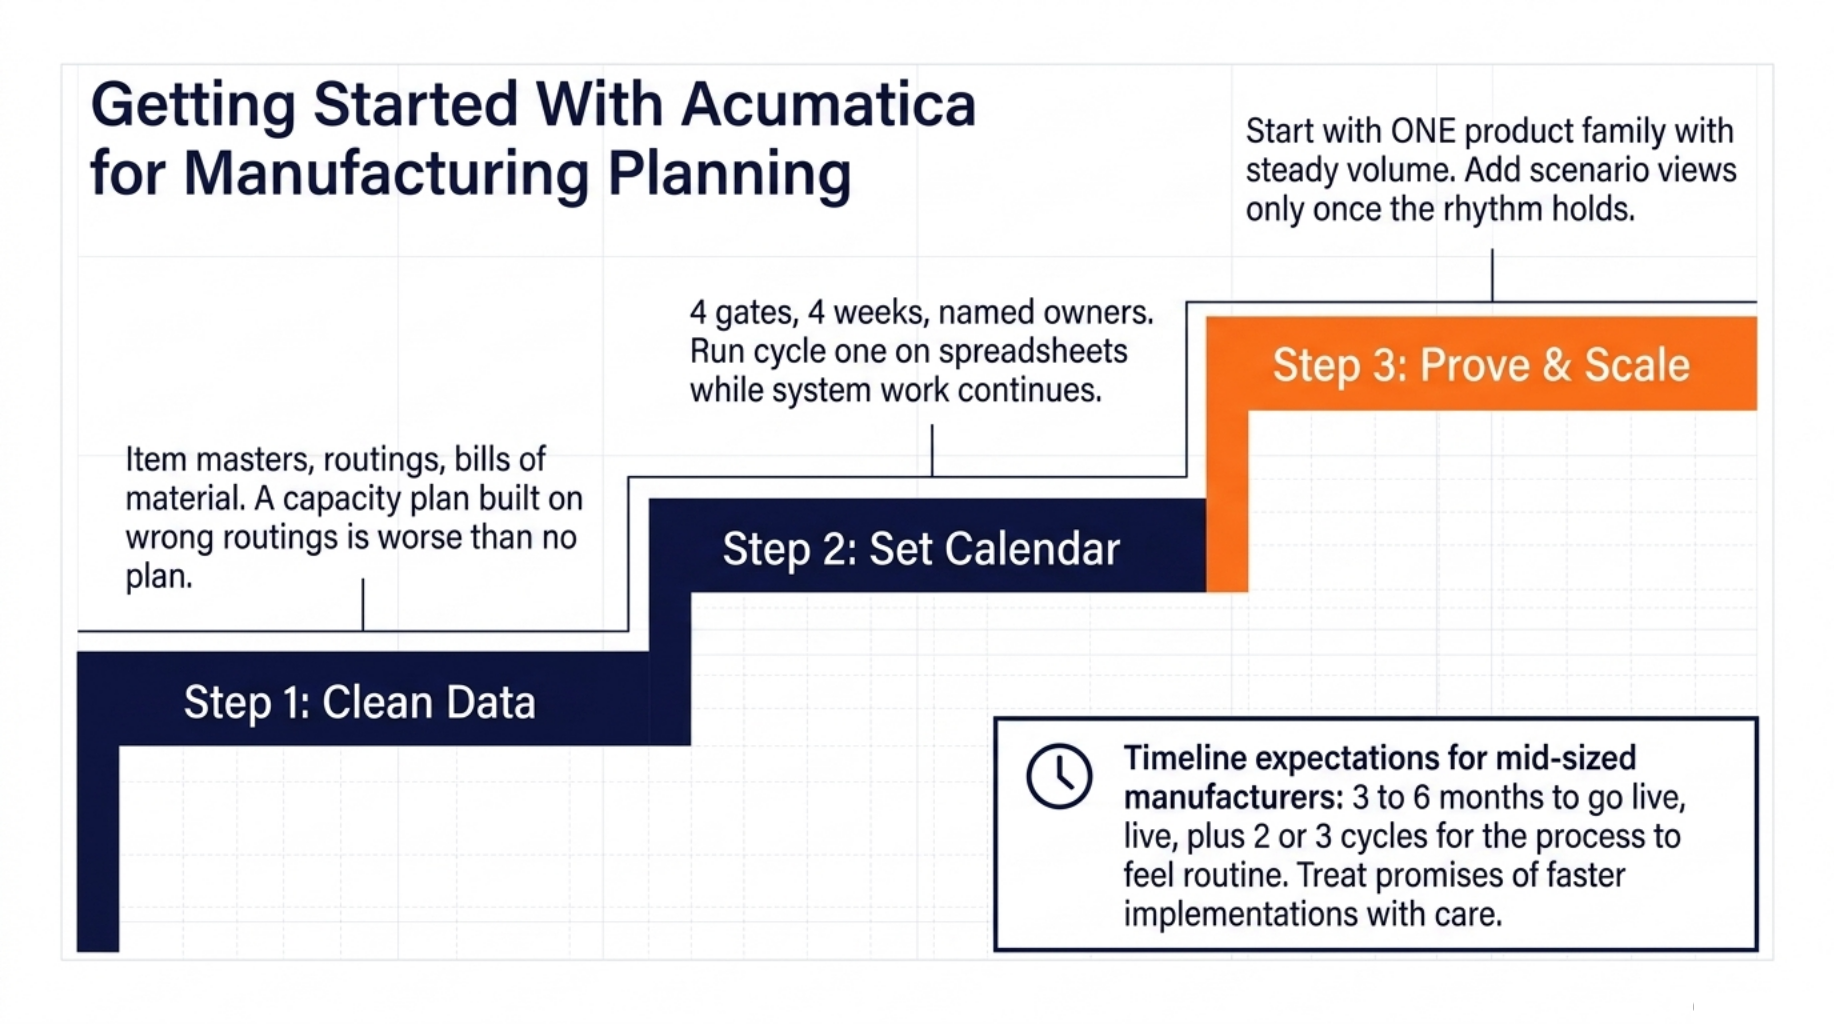
Begin with data, not meetings or modules. Item masters, routings, and bills of material have to be clean because a capacity plan built on a wrong routing is worse than no plan. Most teams find this stage takes longer than the software work.
Set the meeting calendar before you touch a single configuration screen. Four gates, four weeks, named owners. You can run the first cycle on spreadsheets while the system work continues.
Run that first cycle on one product family. Choose one with steady volume and a manageable SKU count, not the messiest corner of the catalogue.
Add capacity planning and scenario views once the rhythm holds. Layering tools onto a process people are still learning slows both down.
Track forecast accuracy from cycle one, even if the first number is embarrassing. Improvement is the proof point that keeps sponsors engaged.
On timing, most mid-sized manufacturers moving to Acumatica plan for three to six months to go live, then two or three cycles before the process feels routine. Treat anyone promising faster with care.
Wrapping Up
Manufacturing Sales and operations planning teams can rely on comes from one agreed plan, not three that quietly compete. The monthly cycle is the engine, and it only works when the executive meeting ends in a signed decision with named owners.
Shared data is what makes the decision possible. Put demand, supply, and finance on one system and the meeting becomes a debate about choices instead of an argument about numbers.
Ready to see it working? Book an Acumatica manufacturing demo and ask the team to build a live S&OP dashboard using your product families.
FAQ
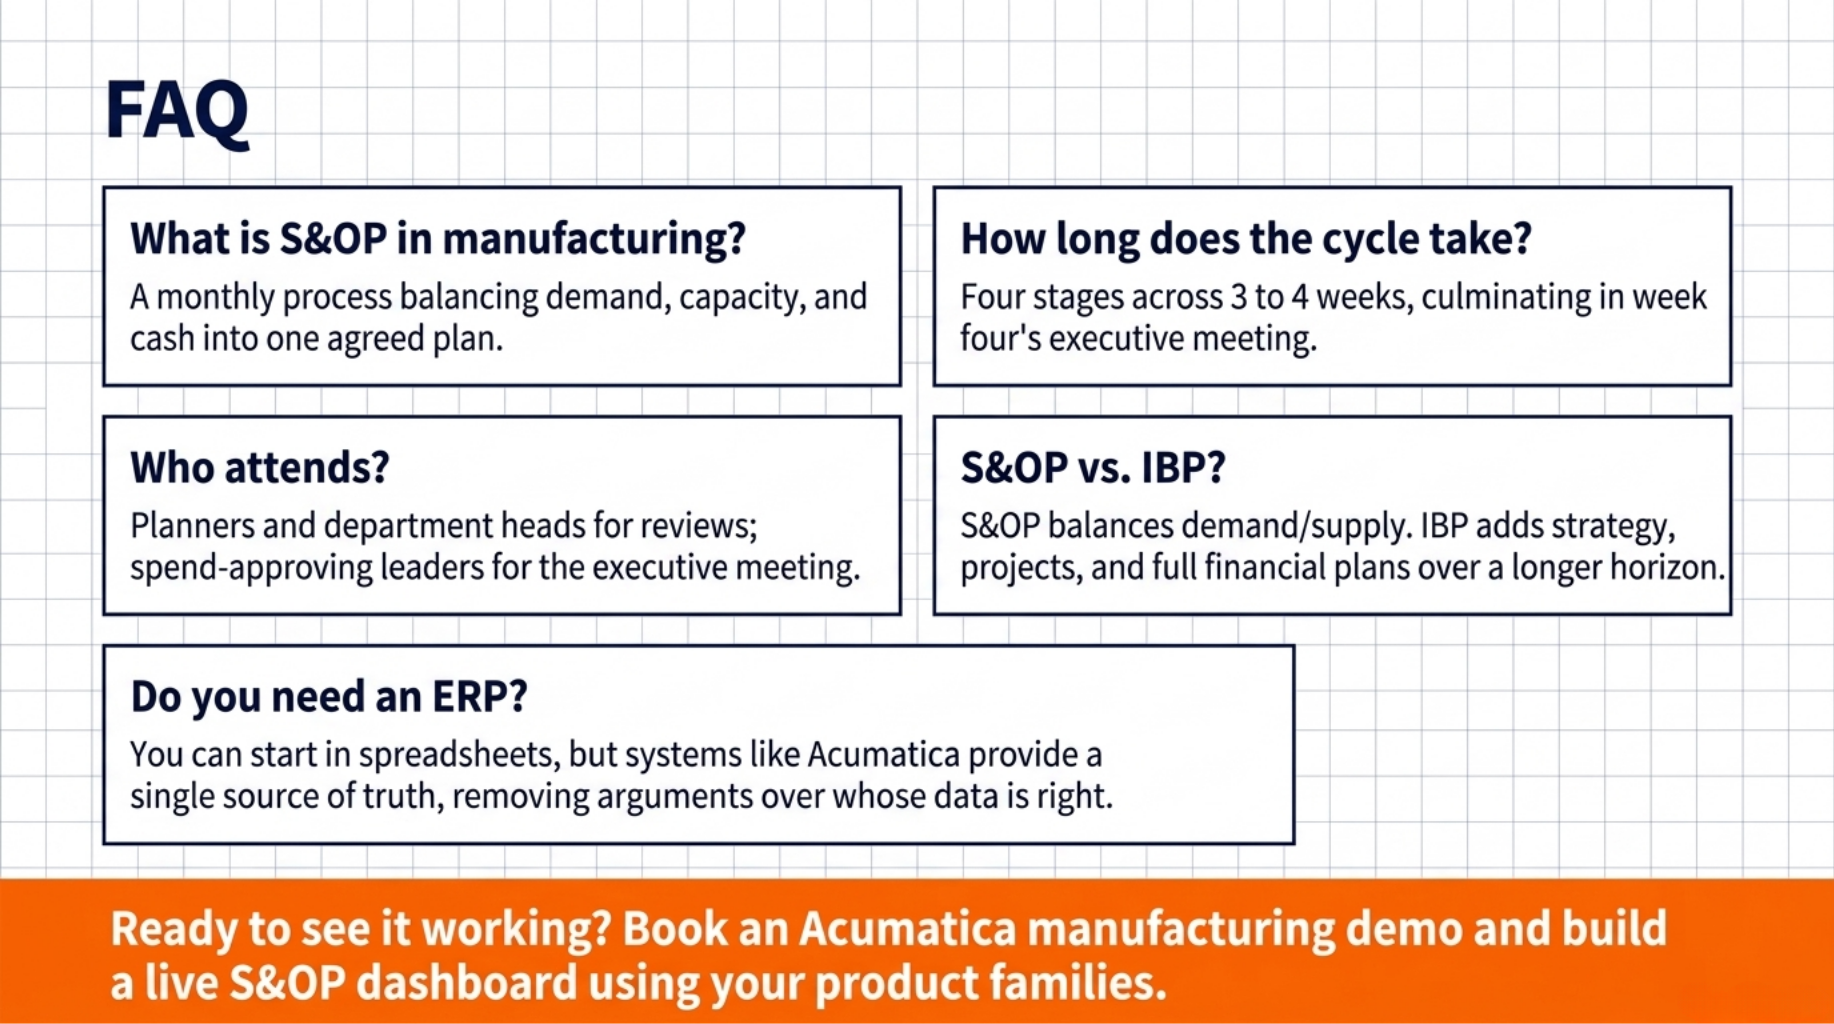
Q1: What is sales and operations planning in manufacturing?
A: It is a monthly process where sales, operations, and finance agree on one plan that balances customer demand against plant capacity and cash.
Q2: How long does the S&OP cycle take each month?
A: Most manufacturers run the four stages across three to four weeks, with the executive decision meeting held in the final week.
Q3: Who should attend an S&OP meeting?
A: Demand and supply reviews need planners and department heads, while the executive meeting needs the leaders who can approve spend and change the plan.
Q4: What is the difference between S&OP and integrated business planning?
A: S&OP balances demand and supply, while integrated business planning adds strategy, projects, and full financial plans over a longer horizon.
Q5: Do you need an ERP system to run S&OP?
A: You can start in spreadsheets, but an ERP system like Acumatica gives every team one set of numbers and removes the arguments over whose data is right.