



Short Summary
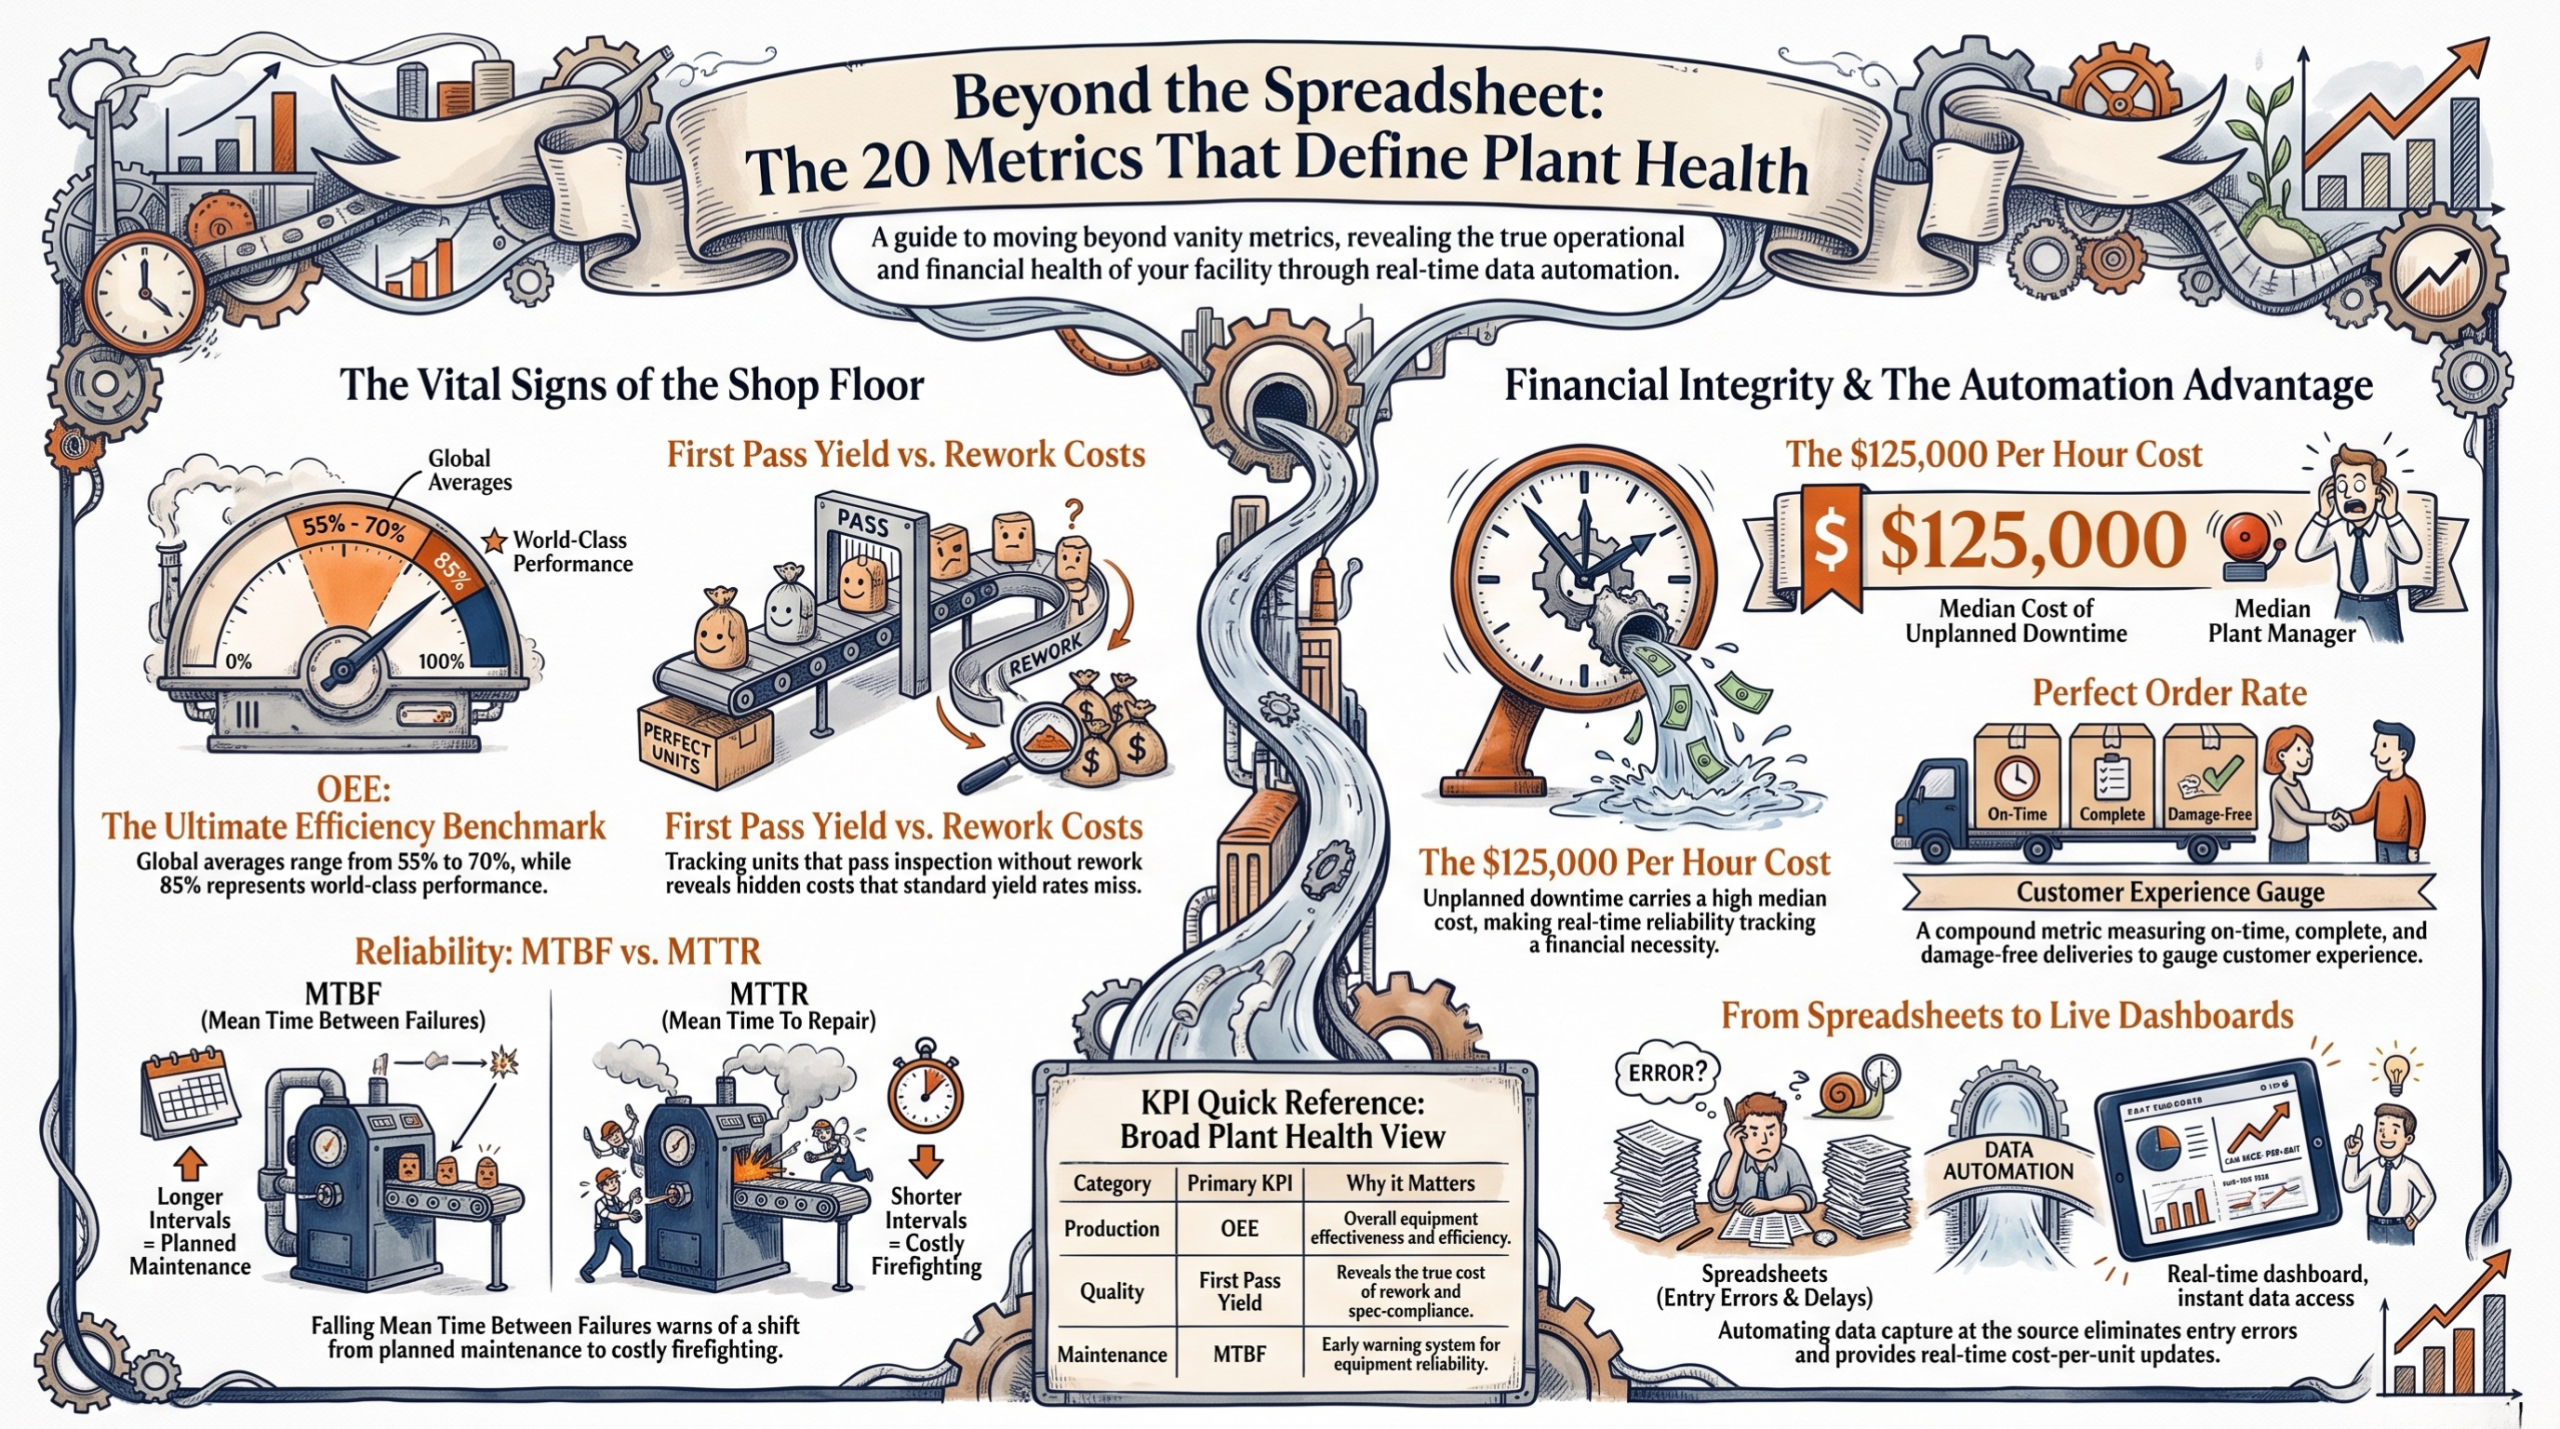
This article explains the 20 most important manufacturing KPIs plants should track, grouped into six categories: production, quality, maintenance, supply chain, safety, and finance. It emphasises that the right KPIs help managers spot problems early, improve efficiency, and make better decisions. It also highlights how Acumatica automates KPI tracking through a live dashboard.
Key Points
- Core production KPIs like OEE, throughput, cycle time, and utilisation show how well the plant is running.
- Quality KPIs such as yield, first pass yield, scrap rate, and defect rate reveal how much output meets spec.
- Maintenance KPIs like MTBF, MTTR, planned maintenance percentage, and unplanned downtime measure equipment reliability.
- Supply chain, safety, and financial KPIs track delivery performance, workplace incidents, and unit costs/variance.
- Acumatica Manufacturing Edition is presented as a tool that automates data capture and dashboard reporting in real time.

Manufacturing KPIs only work when you track the right ones. Too many plant managers watch a dashboard full of numbers that look impressive but don’t actually explain what’s happening on the floor.
This guide breaks down the 20 metrics that matter most, grouped into six categories, so you can build a scorecard that tells you the truth about your plant.
Each metric below includes a plain definition, a formula, and a note on how to use it. No fluff. Just what you need to run a tighter operation.
Production and Throughput KPIs
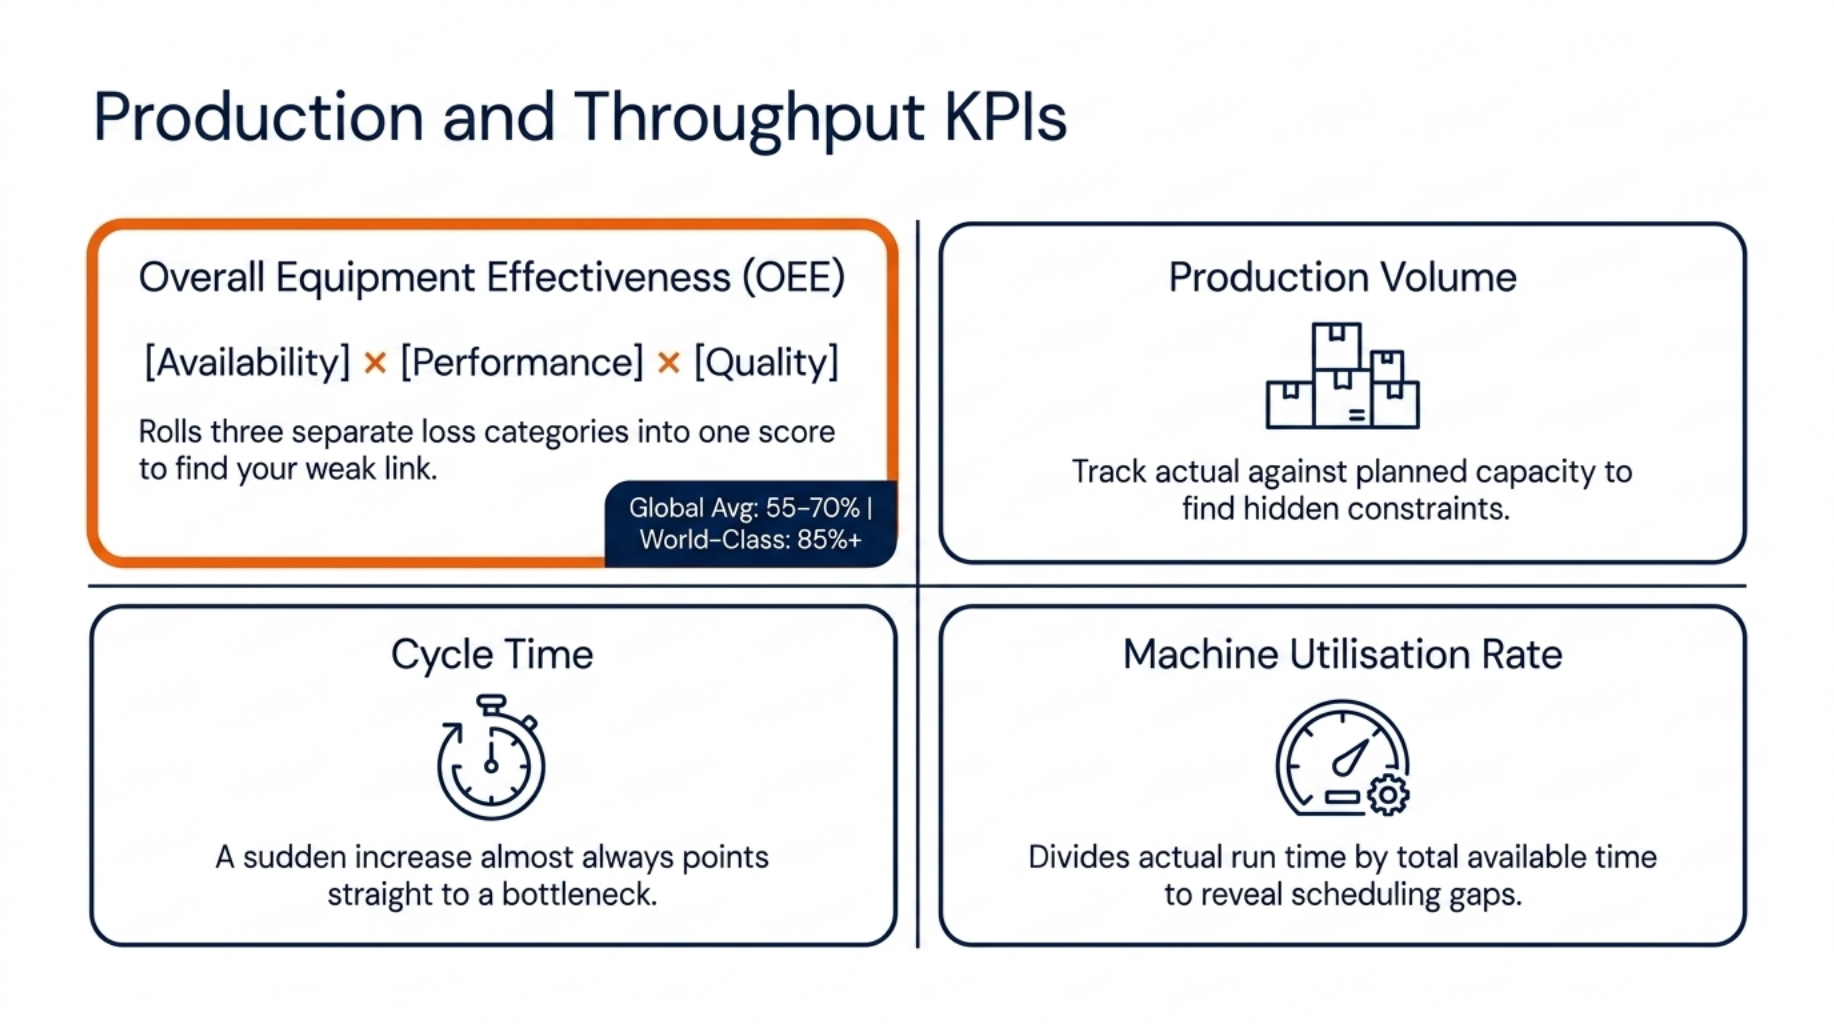
These metrics tell you if your plant makes enough product, fast enough. Overall Equipment Effectiveness sits at the centre of this group because it rolls three separate loss categories into one score. The rest of the metrics here fill in the detail behind that number.
Benchmarks vary a lot by industry. Across discrete manufacturing generally, the global average sits between 55 and 70 percent, with 70 to 80 percent considered advanced, and anything above 80 percent reserved for the top 5 to 10 percent of plants. So if your score sits in the 60s, you’re in normal territory, not falling behind.
Overall Equipment Effectiveness (OEE)
OEE multiplies Availability, Performance, and Quality together. The commonly cited world-class threshold is 85 percent or higher, a benchmark built on Availability above 90 percent, Performance above 95 percent, and Quality above 99.9 percent. A score sitting well below your industry norm points to a specific weak link. Break the number apart to find it.
Production Volume
This is simply the total number of units made in a given period, whether that’s a shift, a day, or a month. Track it against your planned capacity. A steady gap between planned and actual output usually means a hidden constraint somewhere in the line.
Cycle Time
Cycle time measures how long it takes to complete one full production cycle for a single unit. Compare cycle time across shifts or machines doing the same job. A sudden increase almost always points straight to a bottleneck.
Machine Utilisation Rate
This metric divides actual run time by total available time. Use it when deciding whether to buy new equipment or push more work through what you already have. A low rate often means scheduling gaps, not a lack of capacity.
Quality KPIs
Quality metrics show how much of what you make actually meets spec the first time. When scrap or defects climb, the root cause is almost always upstream, in setup, materials, or a process drifting out of control. These numbers connect straight to customer complaints and warranty claims, so they deserve daily attention, not a monthly glance.
Yield Rate
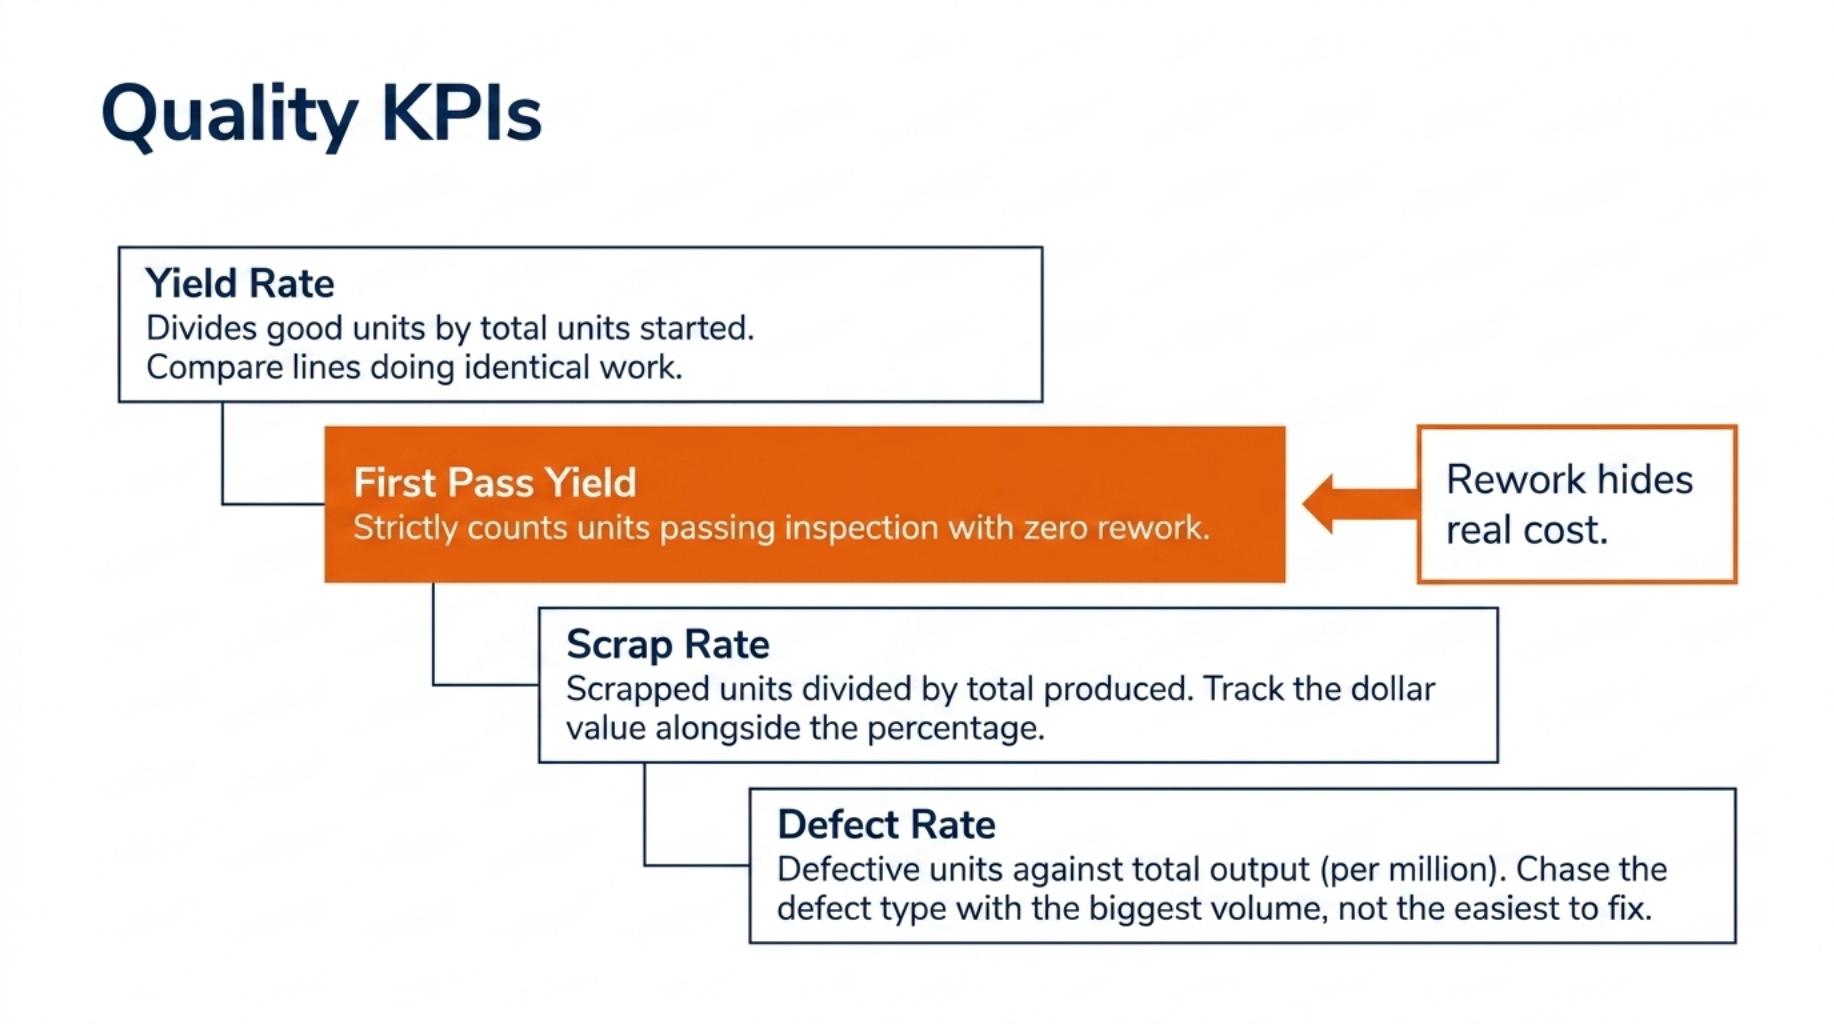
Yield rate divides good units by total units started. Use it to compare lines or shifts doing identical work. A gap between two lines running the same process is a strong signal something on the weaker line needs attention.
First Pass Yield
First pass yield only counts units that pass inspection without any rework. It’s stricter than the overall yield rate because a reworked unit still counts as a loss here, even though it eventually shipped. This distinction matters because rework hides real cost.
Scrap Rate
Scrap rate divides scrapped units by total units produced. Track the dollar value of scrap alongside the percentage. A small percentage increase on an expensive material can quietly become a large cost.
Defect Rate
Defect rate counts defective units against total output, often expressed per million opportunities for high-volume lines. Use this metric to prioritise root cause investigations. Chase the defect type with the biggest volume first, not the one that’s easiest to fix.
Maintenance and Reliability KPIs
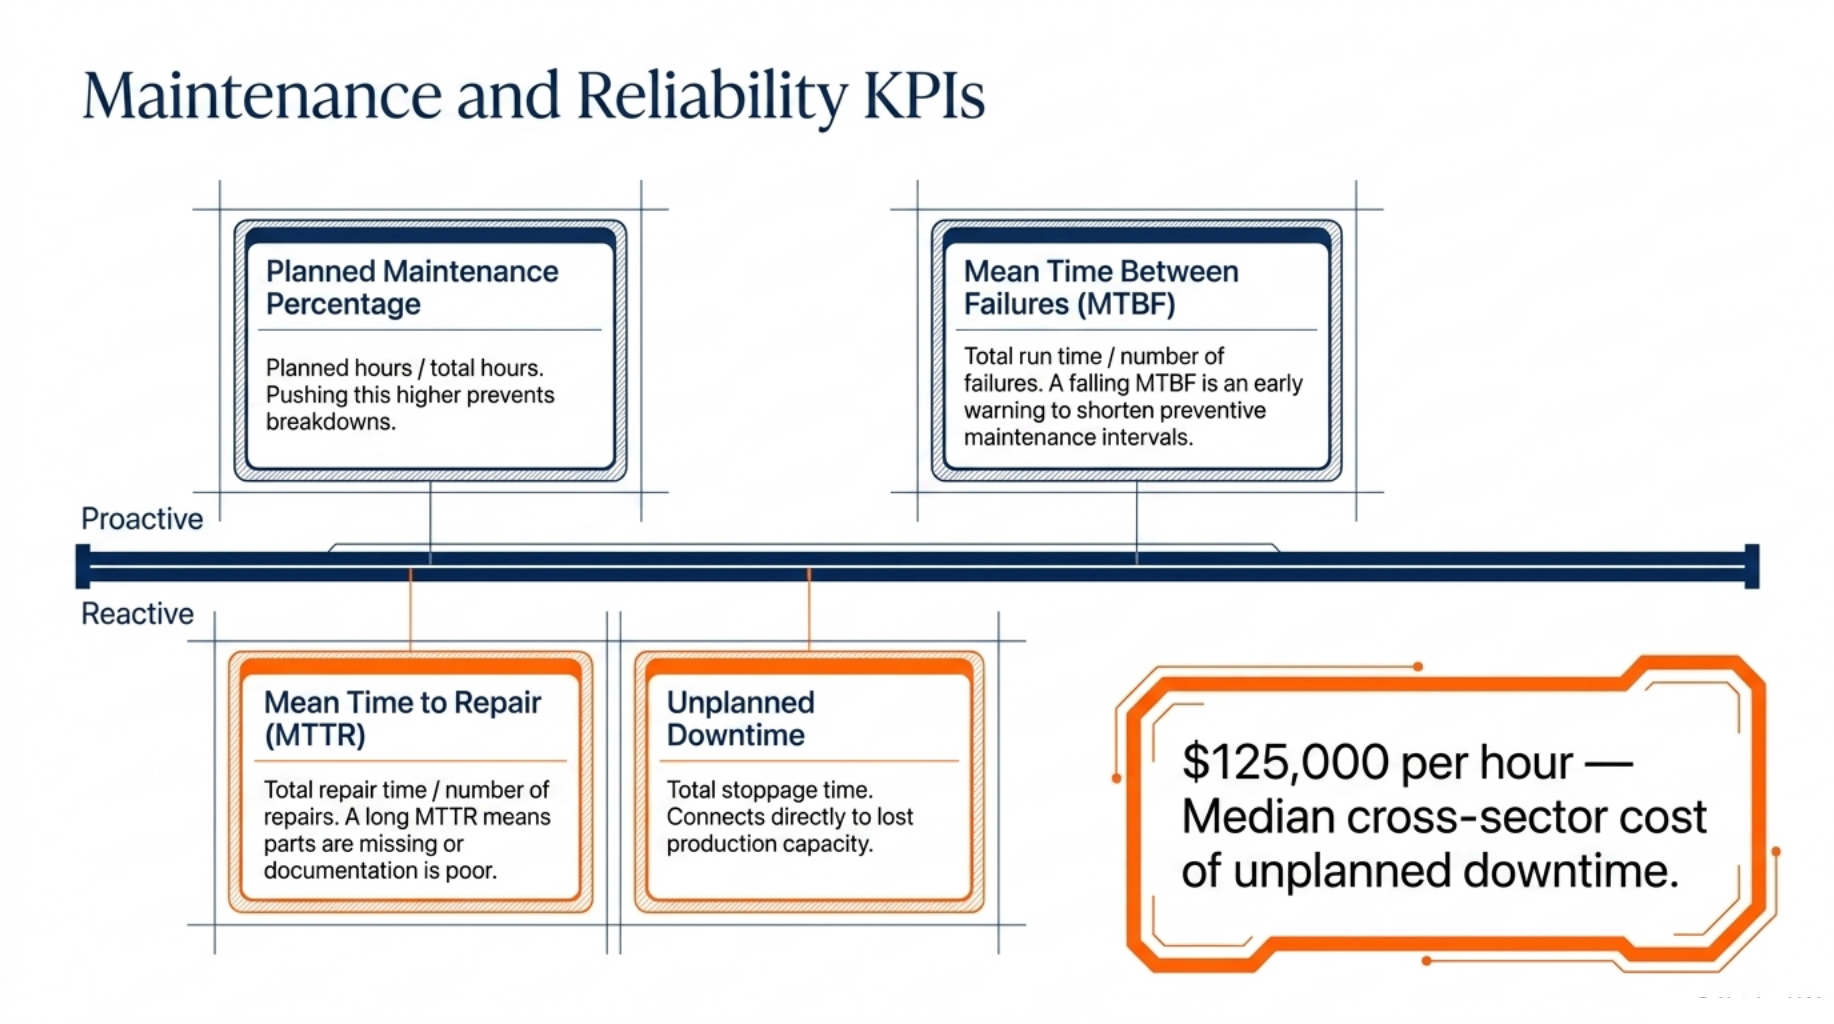
Maintenance metrics show whether your equipment is healthy and whether your maintenance programme is actually working. When Mean Time Between Failures starts falling, it usually means the team has slipped from planned maintenance into constant firefighting. The Planned Maintenance Percentage tells you how much of that firefighting is happening in the first place.
Unplanned downtime is expensive almost everywhere. One large survey of more than 3,200 plant maintenance leaders found a cross sector median cost of roughly $125,000 per hour of unplanned downtime, with automotive plants running far higher. Even a plant far below that median loses real money every time a line stops unexpected.
Mean Time Between Failures (MTBF)
MTBF divides total run time by the number of failures during that period. Use a falling MTBF as an early warning to shift preventive maintenance intervals shorter before failures start costing you real production time.
Mean Time to Repair (MTTR)
MTTR divides total repair time by the number of repairs. A short MTTR usually points to good spare parts stock and well-trained technicians. A long one often means parts are missing or documentation is poor.
Planned Maintenance Percentage
This metric divides planned maintenance hours by total maintenance hours. A higher percentage means your team is preventing breakdowns rather than reacting to them. Most reliability programmes aim to push this number steadily upward year over year.
Unplanned Downtime
These tracks total unplanned stoppage time across a period, usually in hours. It connects directly to lost production capacity, so pair it with your cost per hour of downtime to see the real financial impact.
Supply Chain and Inventory KPIs
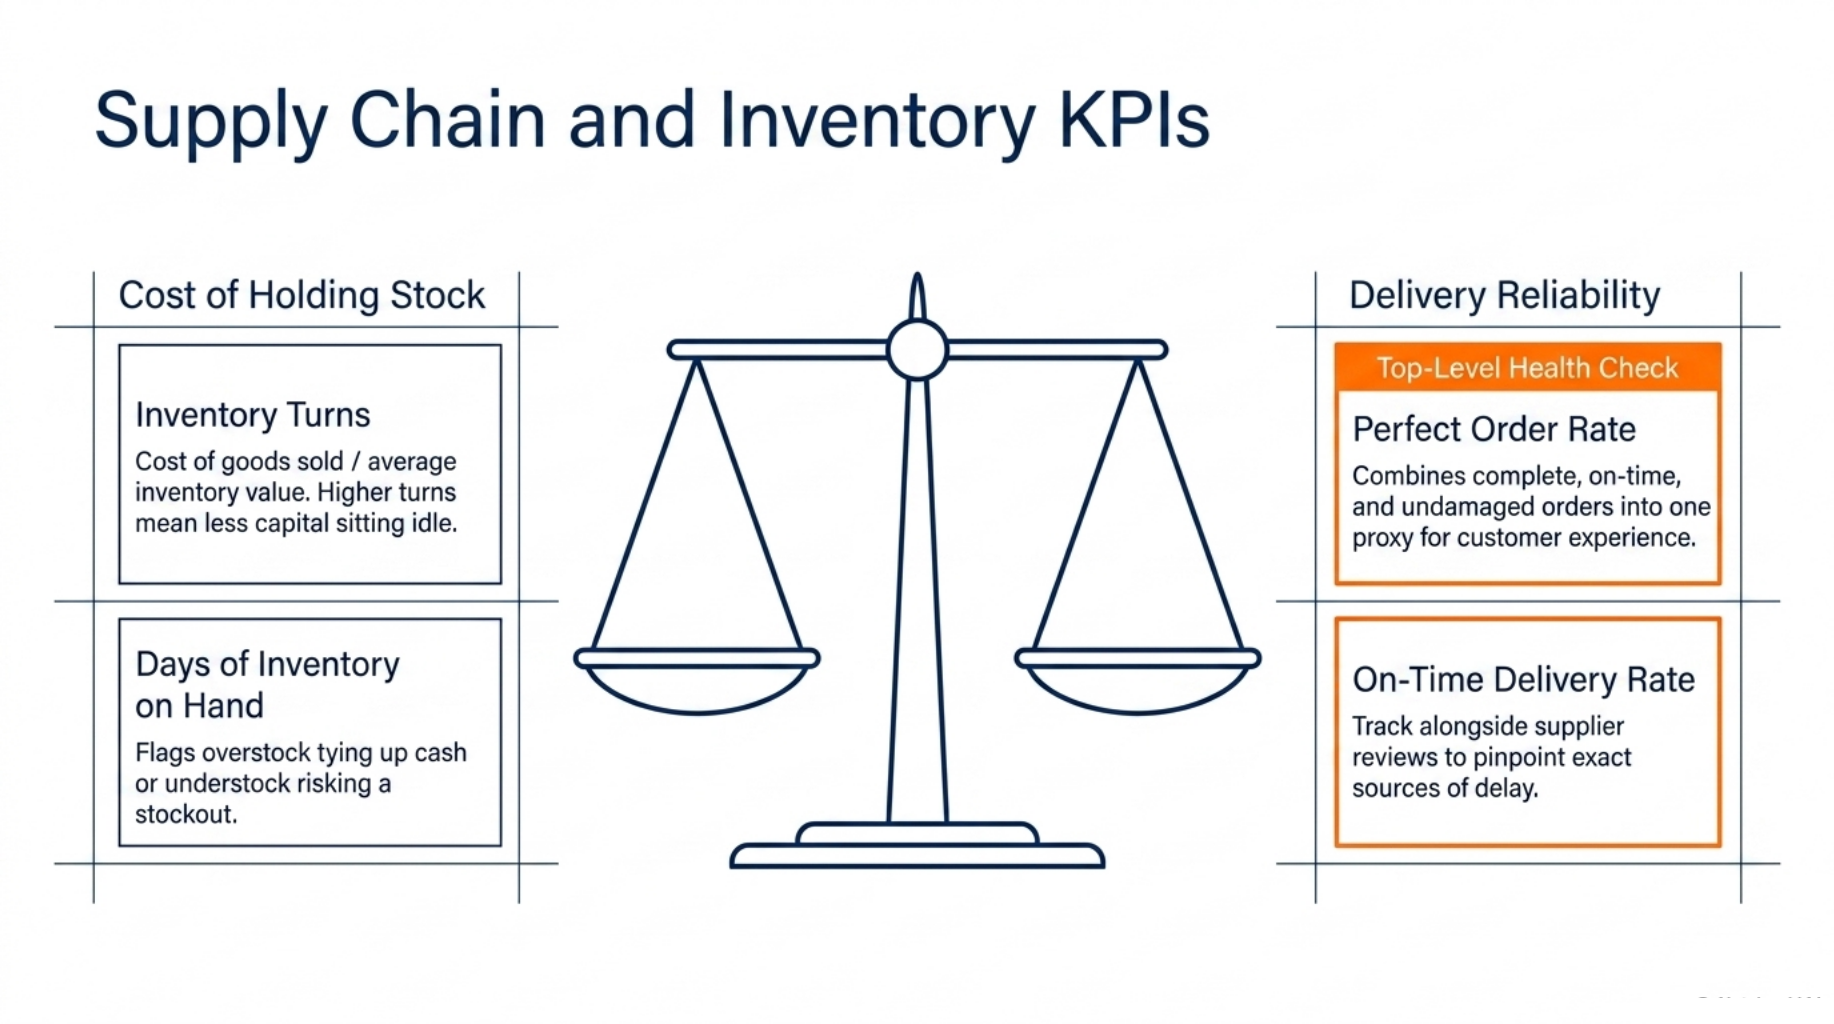
These metrics balance the cost of holding stock against how reliably you deliver to customers. Perfect Order Rate is a compound metric that folds several delivery factors into one score, so treat it as your top-level supply chain health check. Inventory Turns tells you how hard your working capital is working for you.
Inventory Turns
Inventory turns divide cost of goods sold by average inventory value. Higher turns generally mean tighter cash flow and less capital sitting idle on the shelf. Compare your number against similar discrete manufacturers rather than a generic average, since turns vary widely by product type.
Perfect Order Rate
This metric combines orders delivered complete, on time, and without damage into one percentage. Use it as a proxy for how customers actually experience your service. A drop here often shows up in complaints before it shows up anywhere else.
On-Time Delivery Rate
On time delivery rate divides on time shipments by total shipments. Track it alongside supplier and carrier performance reviews. A drop that lines up with one carrier or one supplier points you straight to the source.
Days of Inventory on Hand
These divides average inventory by daily cost of goods sold. Use it to flag overstock tying up cash or understock risking a stockout. Both extremes cost money in different ways.
Safety KPIs
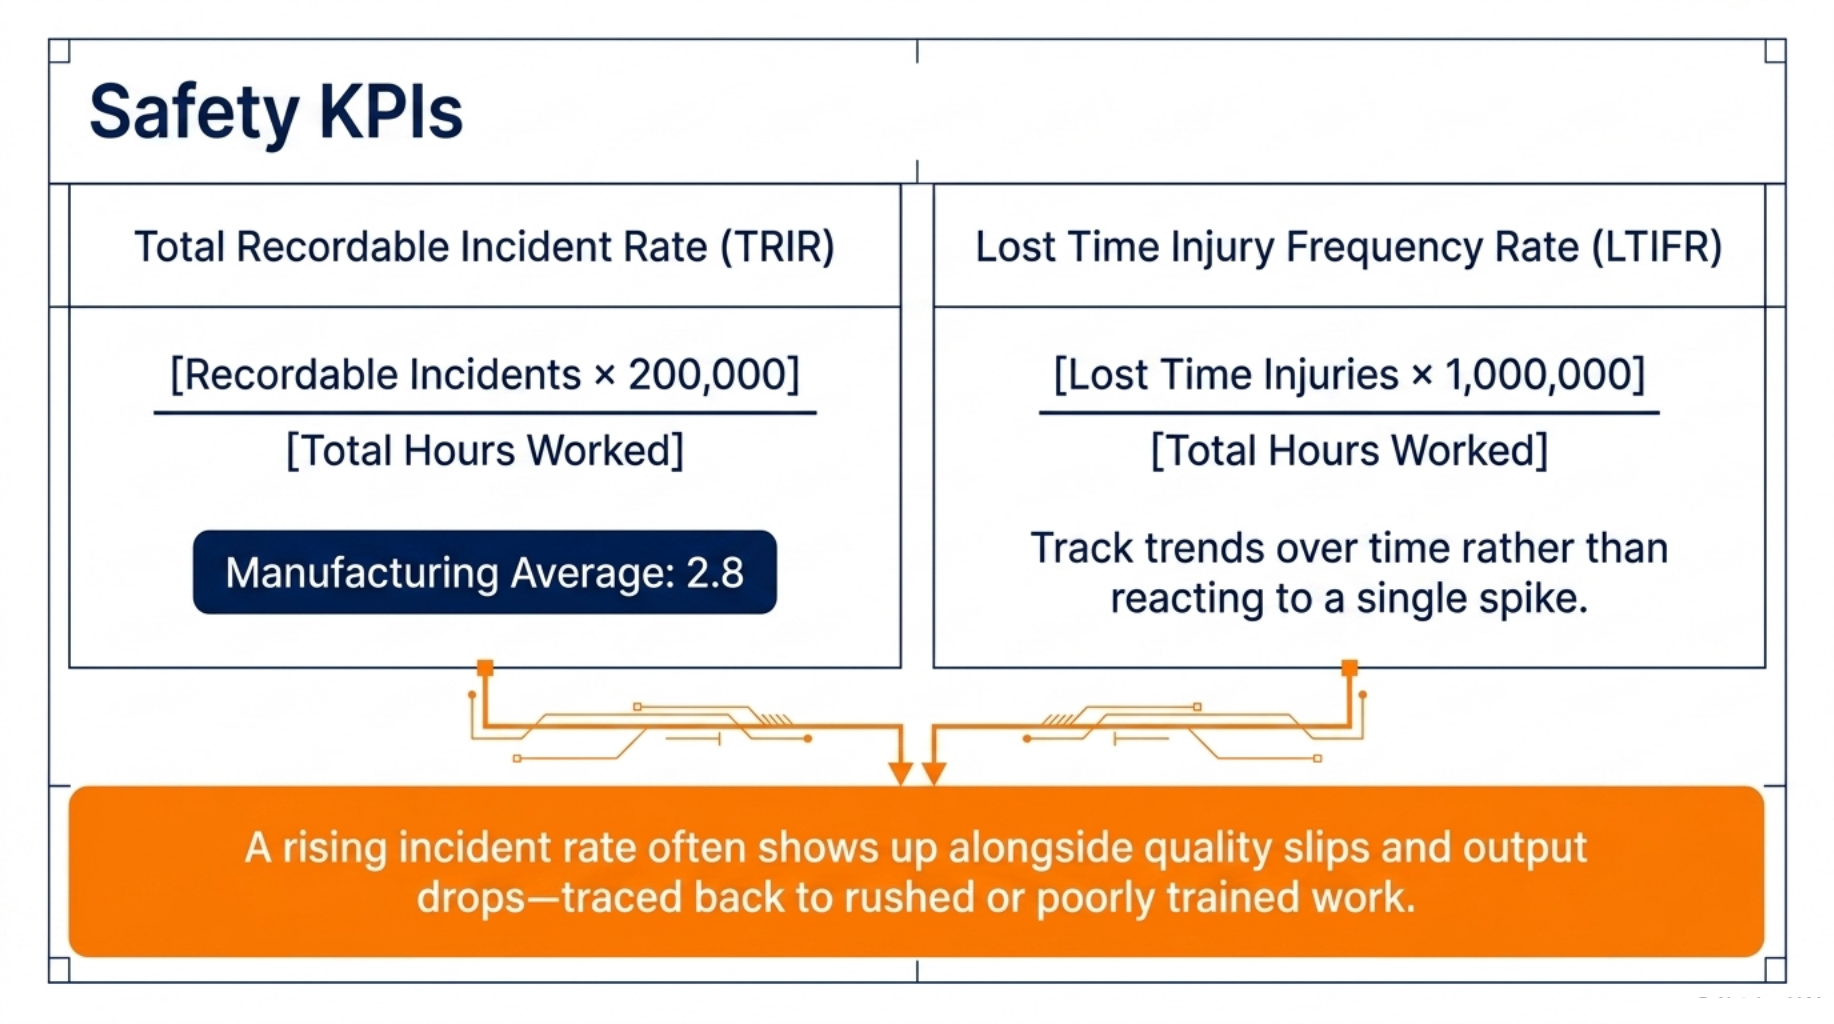
Safety metrics protect your people, and they belong on the same dashboard as your output numbers because the two are connected. A rising incident rate often shows up alongside quality slips and output drops too, since all three usually traces back to rushed or poorly trained work. Regulatory reporting also makes these numbers mandatory, not optional.
Total Recordable Incident Rate (TRIR)
TRIR multiplies recordable incidents by 200,000, then divides by total hours worked. Manufacturing’s average TRIR sat at 2.8 in recent data, giving you a reasonable benchmark to compare against. A rate well above that average is worth investigating, even if no single incident seemed serious.
Lost Time Injury Frequency Rate (LTIFR)
LTIFR multiplies lost time injuries by 1,000,000, then divides by hours worked. Track the trend over several periods rather than reacting to one spike, since a single bad month can distort the picture.
Financial KPIs
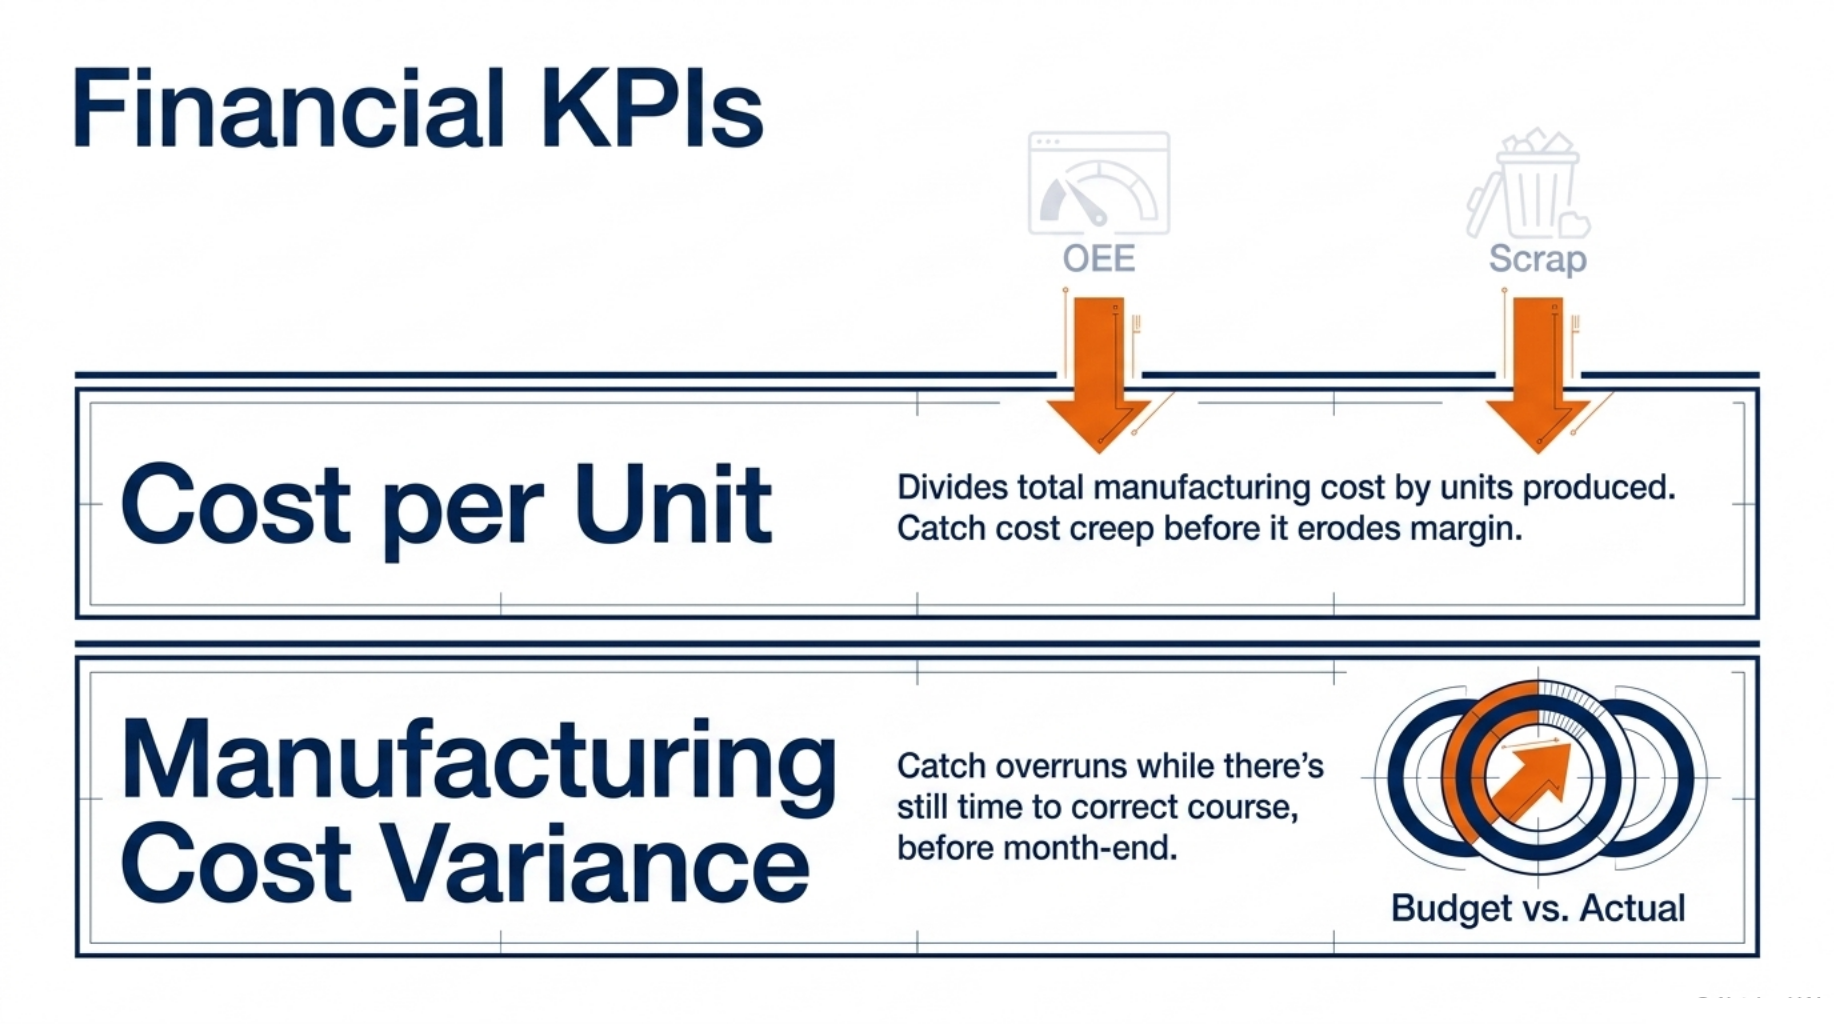
Financial metrics translate everything happening on the floor into dollars and cents. Cost per unit ties directly back to your OEE and scrap rate numbers, since both losses show up here eventually. Manufacturing cost variance is your early warning system for budget drift before it becomes a real problem at month end.
Cost per Unit
Cost per unit divides total manufacturing cost by units produced. Use it to price products accurately and to catch cost creep before it erodes your margin. A rising cost per unit with a flat OEE score usually points to material or labour cost increases, not a process problem.
Manufacturing Cost Variance
This metric subtracts budgeted cost from actual cost. Use it to catch overruns while there’s still time to correct course, rather than discovering the damage after the month closes.
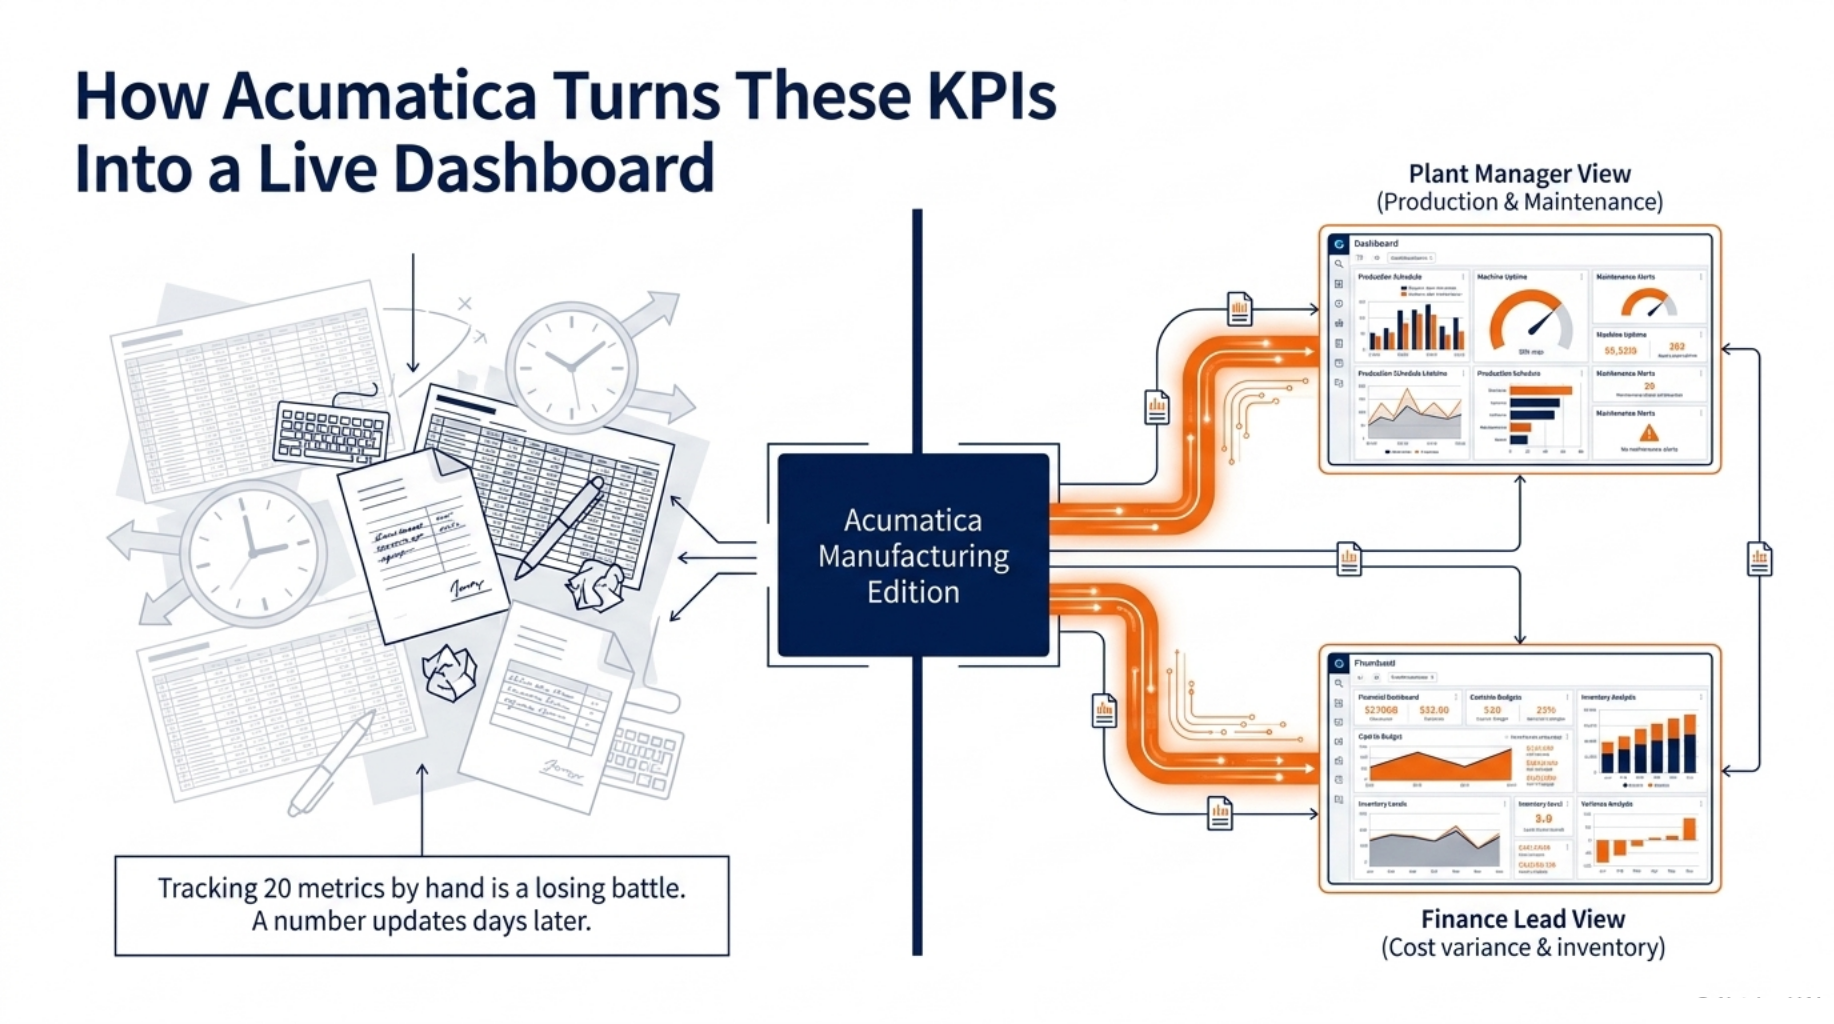
How Acumatica Turns These KPIs Into a Live Dashboard
Tracking 20 metrics by hand across separate spreadsheets is a losing battle. Acumatica Manufacturing Edition pulls data straight from production, inventory, and finance into one connected system, so a number like cost per unit updates automatically the moment a job closes, rather than waiting for someone to compile it days later.
That real-time link matters most for metrics like OEE and scrap rate, which change by the hour on a busy floor. Role-based dashboards mean a plant manager sees production and maintenance metrics front and centre, while a finance lead sees cost variance and inventory turns without digging through the same clutter. Manufacturers who move off manual reporting consistently report far less time spent compiling numbers and more time acting on them.
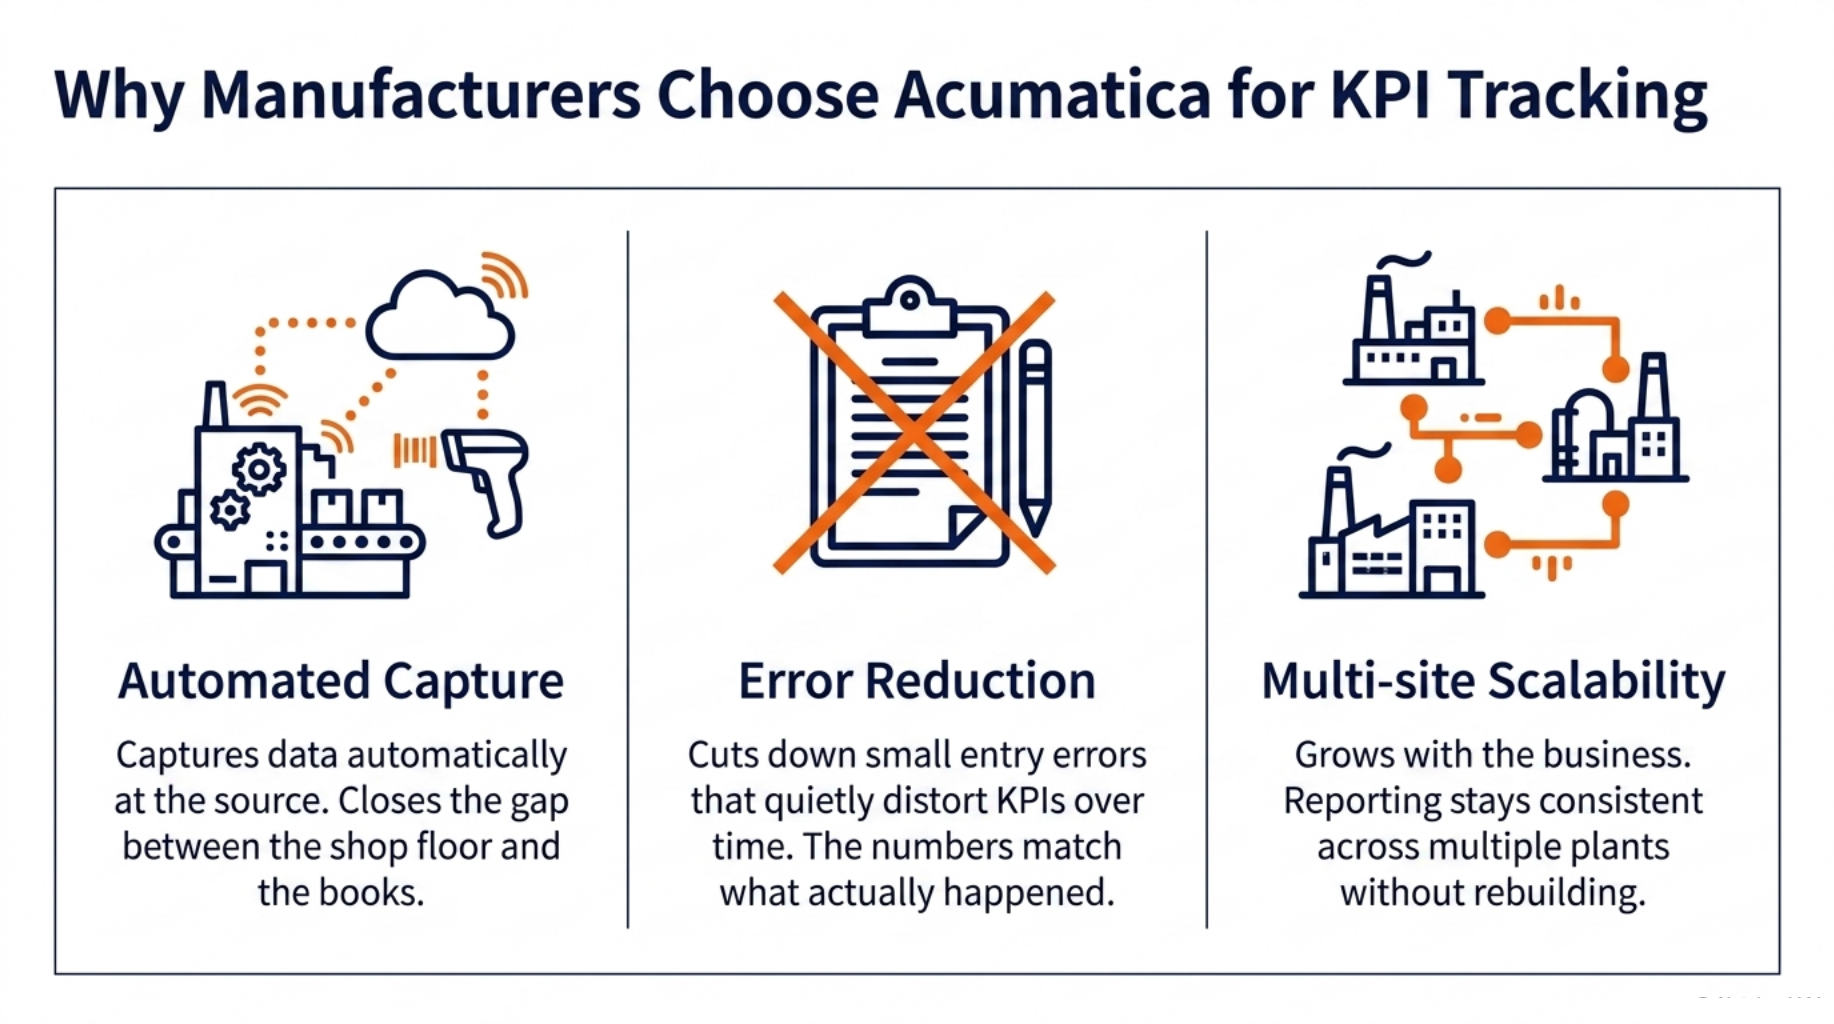
Why Manufacturers Choose Acumatica for KPI Tracking
Spreadsheets break the link between what happens on the shop floor and what shows up in your books. Acumatica closes that gap by capturing data automatically at the source, whether that’s a machine, a scan gun, or a clock, so the numbers on your dashboard match what actually happened, not what someone remembered to type in later.
Automated capture also cuts down on the small entry errors that quietly distort KPIs overtime. And because the system scales across multiple plants or sites from one platform, a growing manufacturer doesn’t need to rebuild its reporting every time it opens a new facility. Reporting stays consistent as the business grows, which is precisely when consistency starts to matter most.
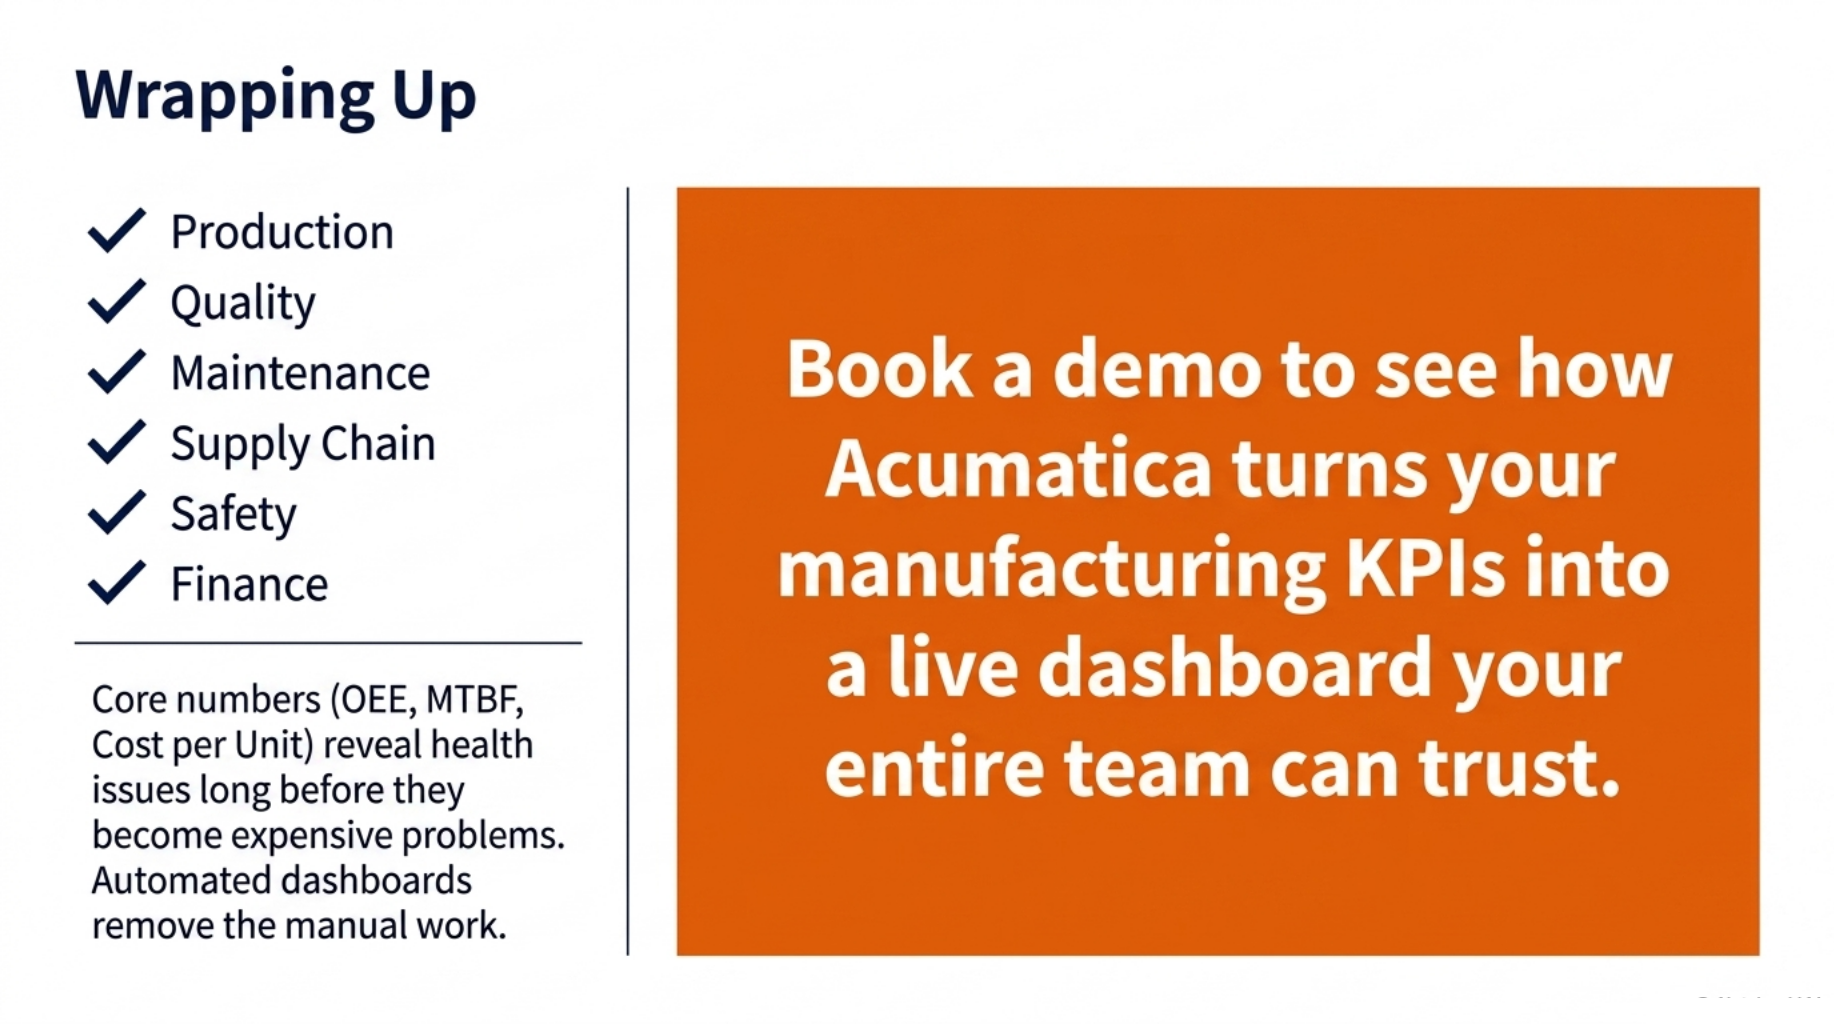
Wrapping Up
Manufacturing KPIs only earn their place on a dashboard if they get tracked consistently across production, quality, maintenance, supply chain, safety, and finance. A handful of core numbers such as OEE, MTBF, and cost per unit will reveal most plant health issues long before they become expensive problems. Automated dashboards remove the manual work that keeps busy teams from actually using their KPIs day to day.
Book a demo to see how Acumatica turns your manufacturing KPIs into a live dashboard your entire team can trust.
FAQ
What are the most important manufacturing KPIs to track?
OEE, first pass yield, MTBF, on time delivery rate, and cost per unit together give the broadest view of plant health.
How is OEE calculated?
OEE equals Availability multiplied by Performance multiplied by Quality, expressed as a percentage.
What is a good OEE benchmark for a manufacturing plant?
Most discrete manufacturers fall between 55 and 70 percent, with anything above 80 percent considered top tier and rarely sustained.
How often should plant managers review manufacturing KPIs?
Most plants review production and safety KPIs daily, and financial KPIs weekly or monthly.
Can ERP software automate manufacturing KPI tracking?
Yes, platforms like Acumatica pull data from production, inventory, and finance into a single live dashboard automatically.