




Summary
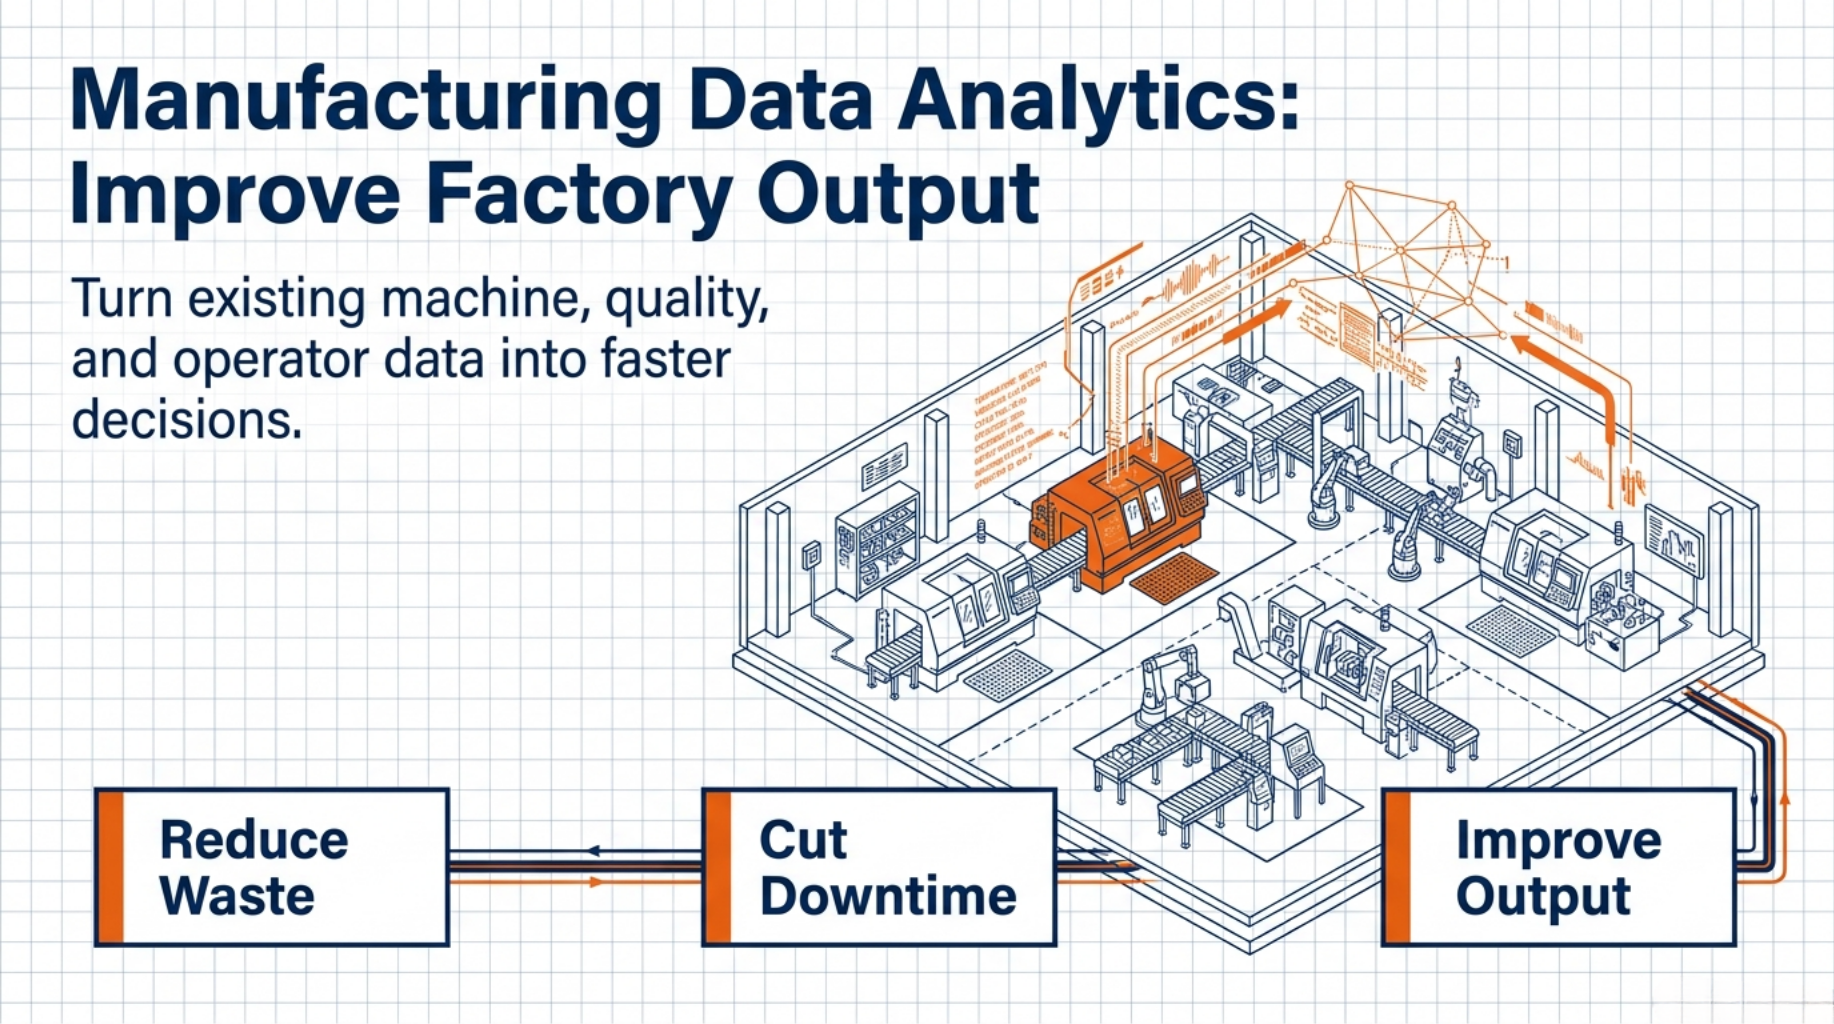
Manufacturing data analytics helps factories turn existing machine, quality, ERP, and operator data into faster decisions that improve scrap, downtime, throughput, and delivery performance. The main lesson is to start with clean, governed data and one high-value use case, then scale from descriptive reporting to predictive and prescriptive analytics.
Key points
- Data already exists in most plants, but much of it is unused or inconsistent across machines, business systems, and people.
- Data quality and governance come first: define terms clearly, assign owners, and fix data at the source instead of cleaning reports later.
- Analytics maturity progresses in stages: manual → connected → predictive → prescriptive, with each stage building on the last.
- Best first use cases are usually in quality, maintenance, production/OEE, or supply chain because they have clear financial impact.
- Success depends on a small team and clear tools: one sponsor, one data owner, one analyst, and a shop floor champion working on one metric at a time.
Introduction
Manufacturing data analytics does not start with new machines. It starts with the record your plant already creates every shift. Cycle times, scrap counts, work orders, stop reasons and supplier deliveries all pile up somewhere.
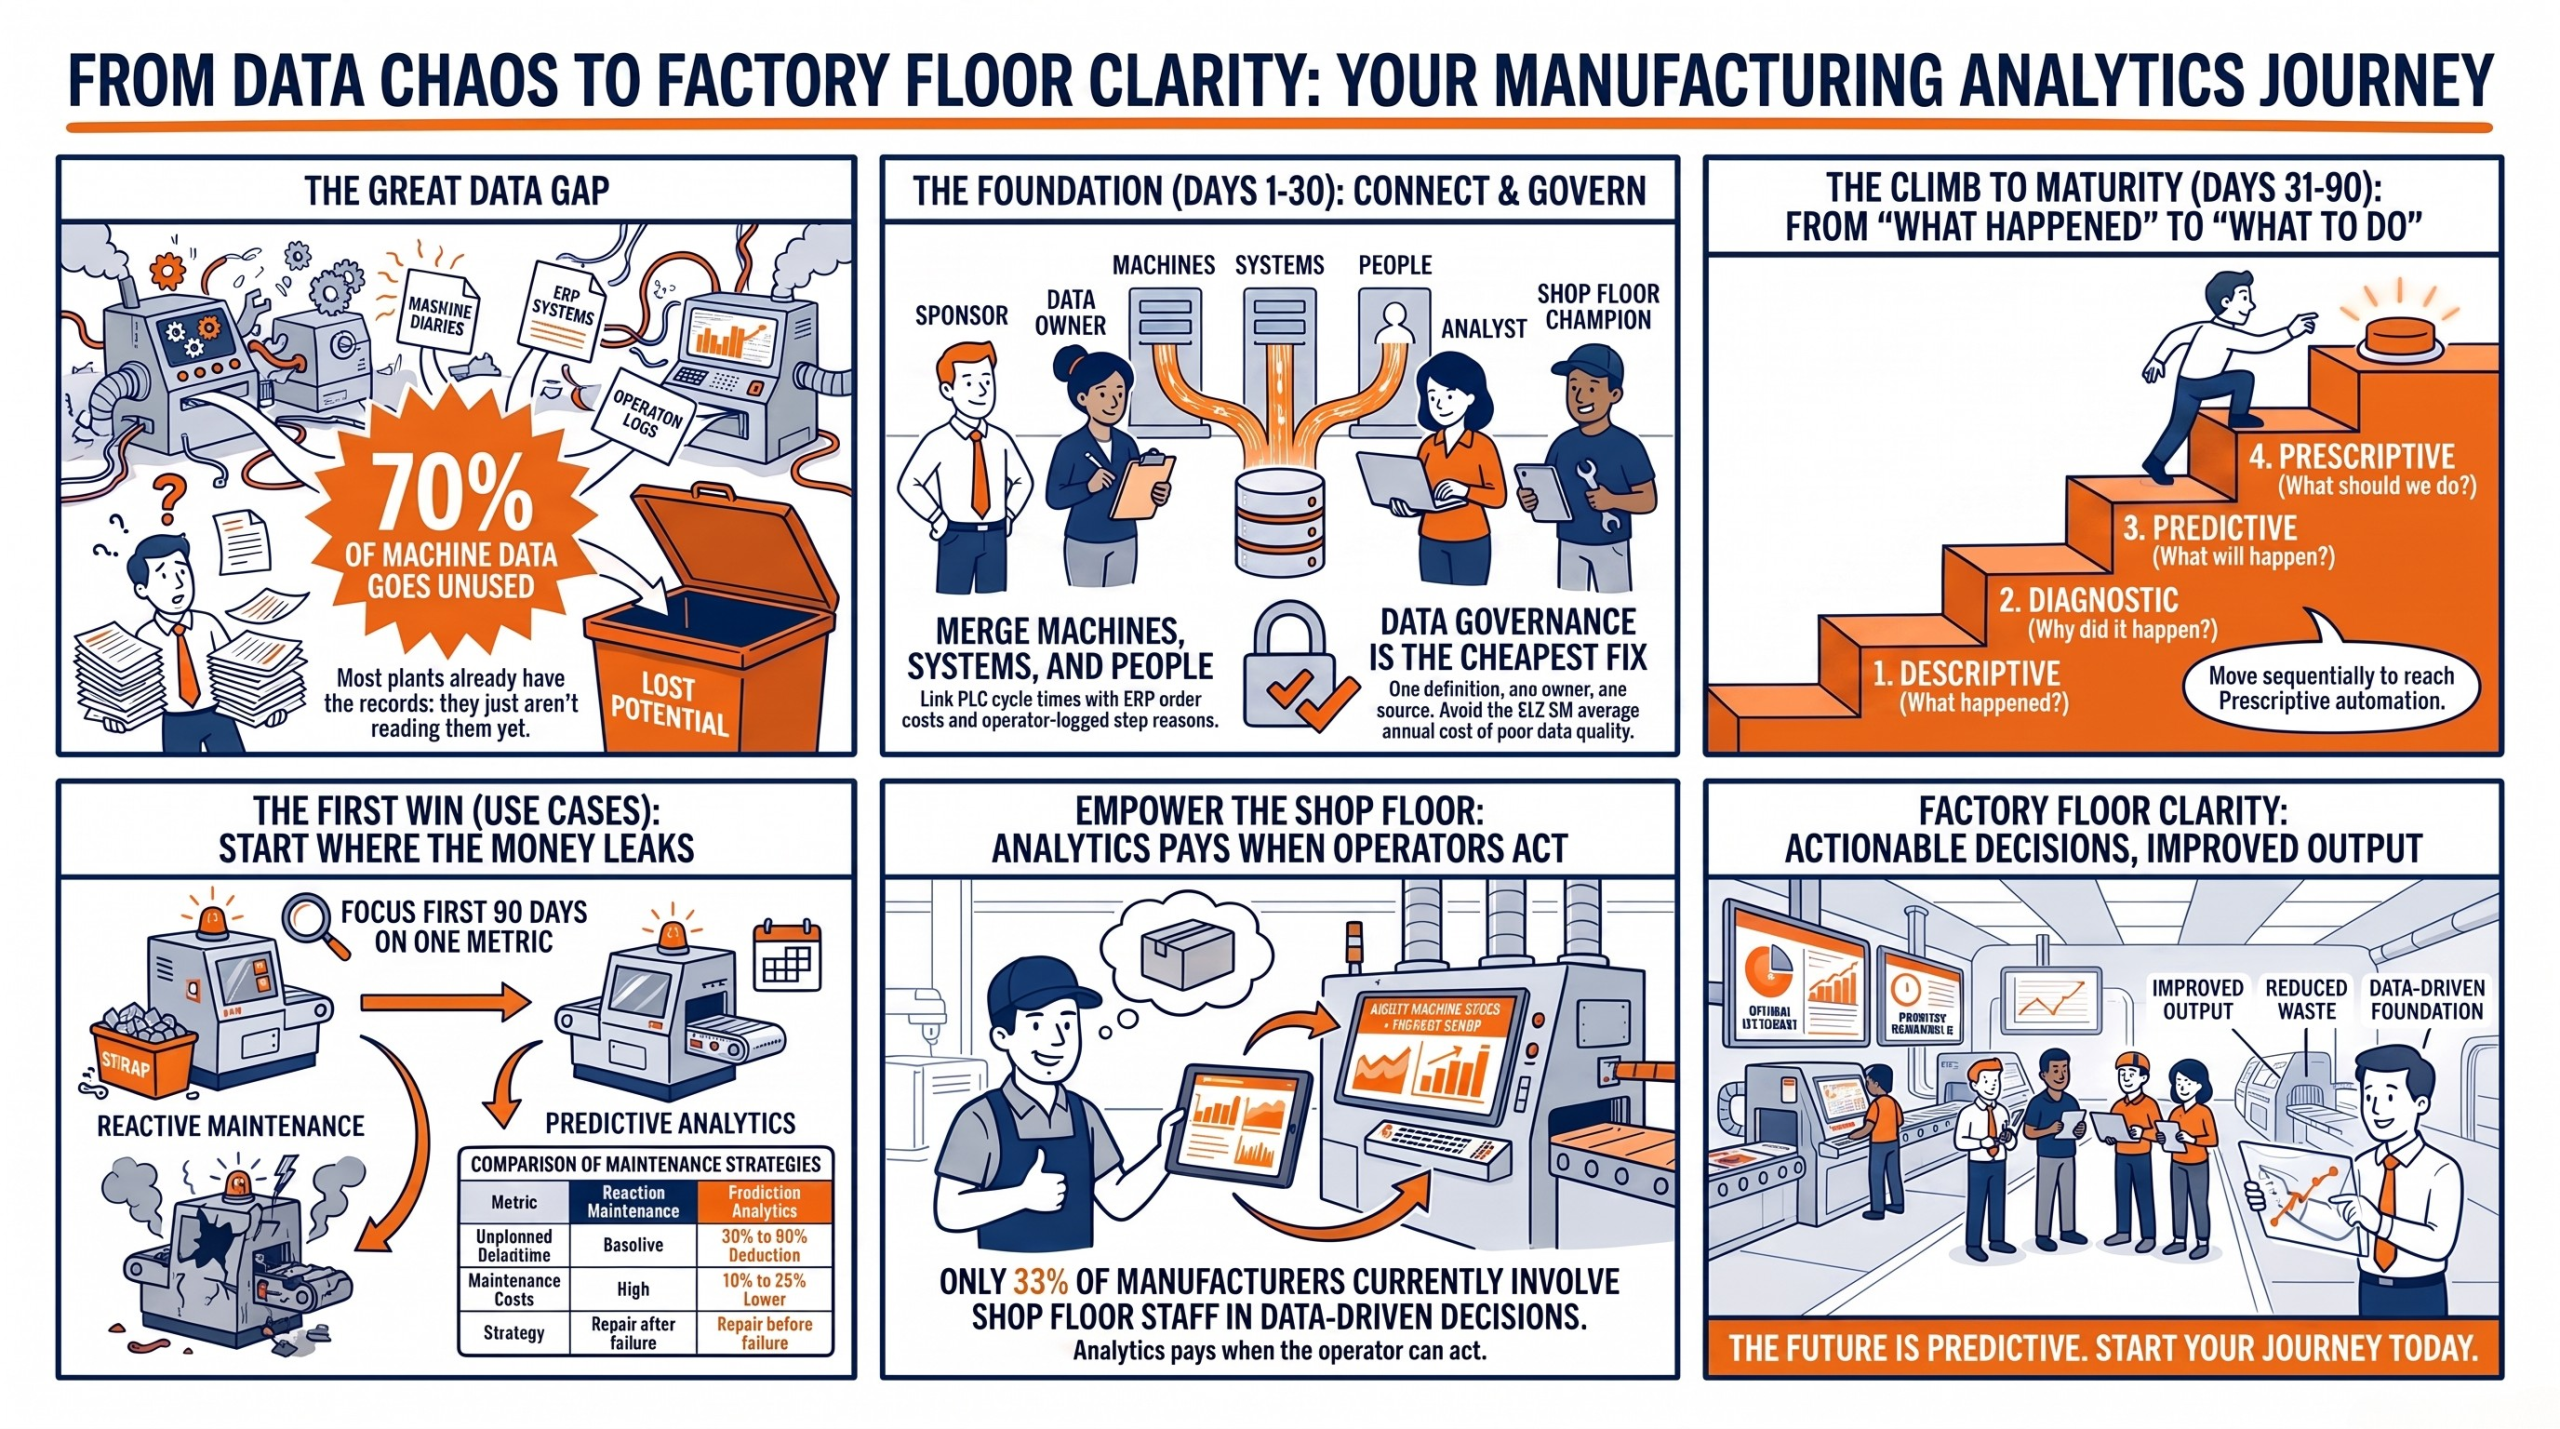
The problem is that almost none of it gets used. A Manufacturing Leadership Council survey found 70% of manufacturers still collect data by hand. Industry estimates put the share of machine data that goes unused at roughly the same level.
That gap is your opening. This guide shows you where factory data comes from, how to keep it clean, and how to turn it into decisions that lift output and margin. You will also get the use cases that pay back first, a simple team structure, a buying checklist and a maturity model you can place your plant on today.
What Manufacturing Data Analytics Really Delivers
Data you cannot trust is just noise with a timestamp.
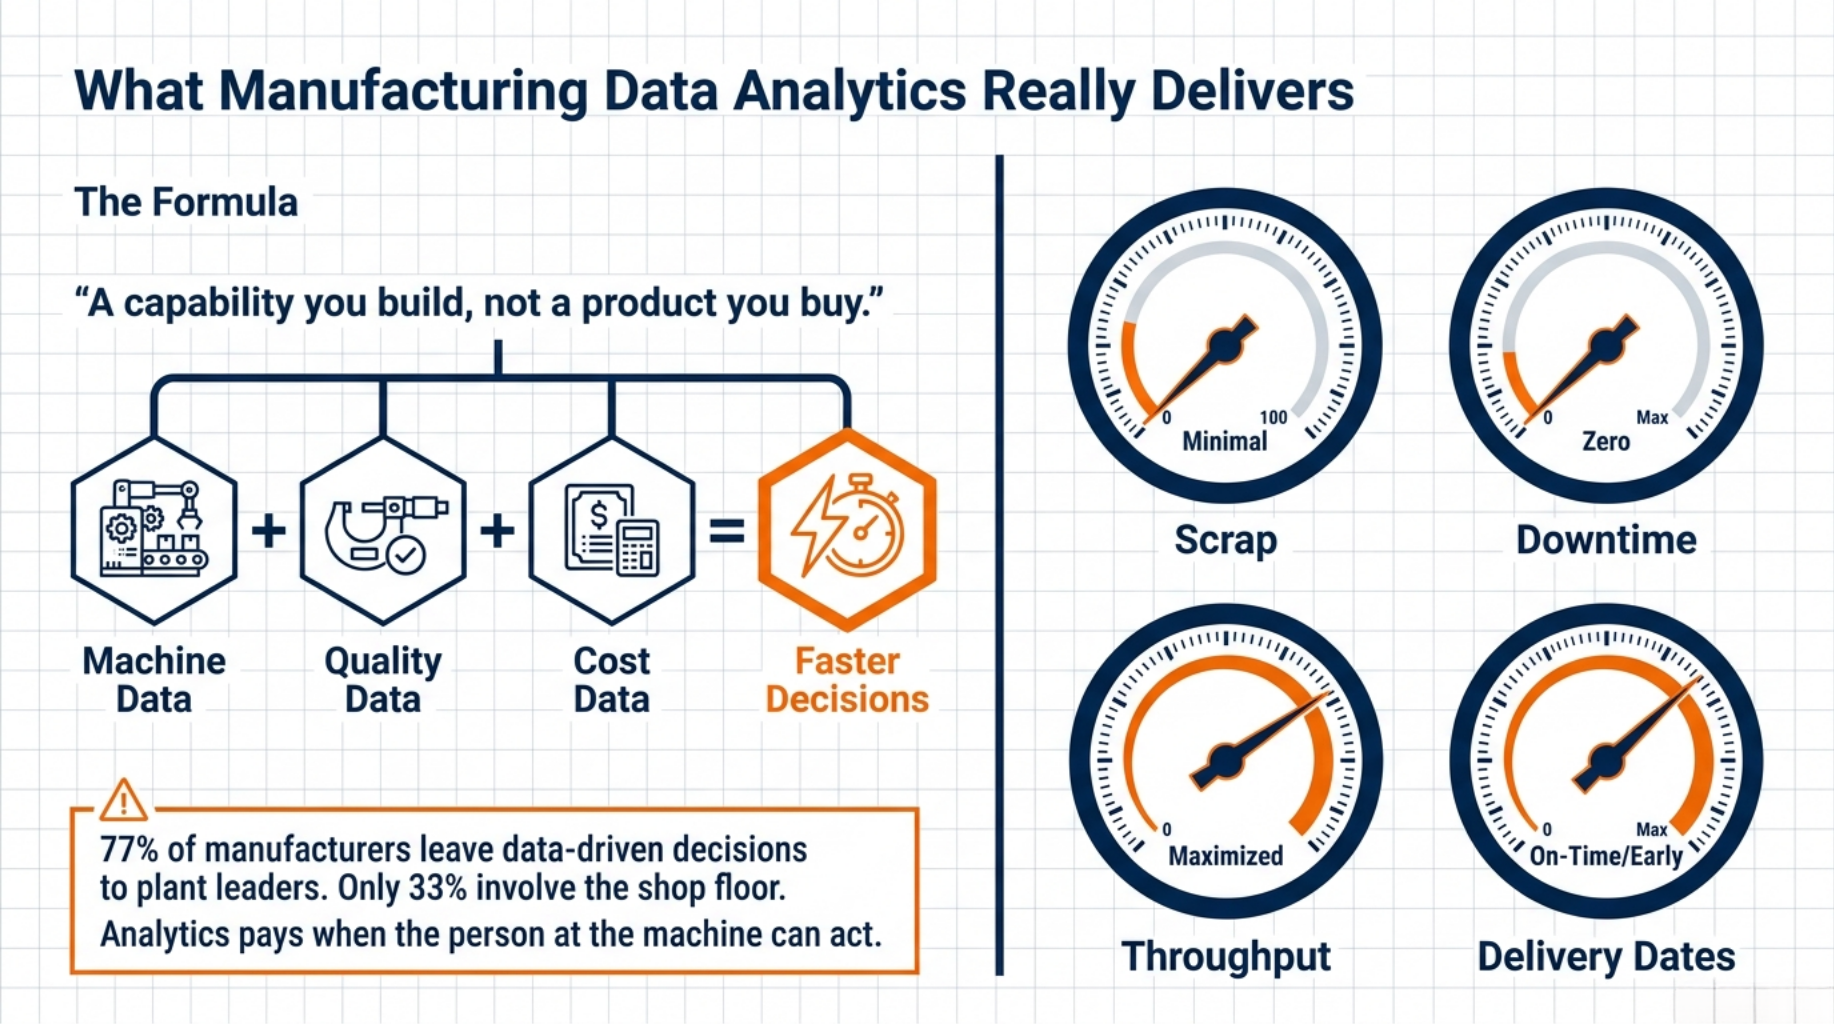
Start with the plain definition. Manufacturing data analytics is the practice of pulling data from machines, systems and people, then using it to run the plant better. It is a capability you build, not a product you buy.
It works by joining records that usually sit apart. Machine data tells you how a line ran. Quality data tells you what came off it. Order and cost data tell you what that was worth.
The payoff lands in four places: scrap, downtime, throughput and delivery dates. Those are numbers your plant manager already answers for. The goal is faster decisions, not prettier reports.
The same survey found 77% of manufacturers leave data driven decisions to plant leaders and managers, while only 33% give shop floor staff any part in them. Analytics pays when the person at the machine can act on what it says.
Where Your Factory Data Comes From
Every machine keeps a diary. Most plants never read it.
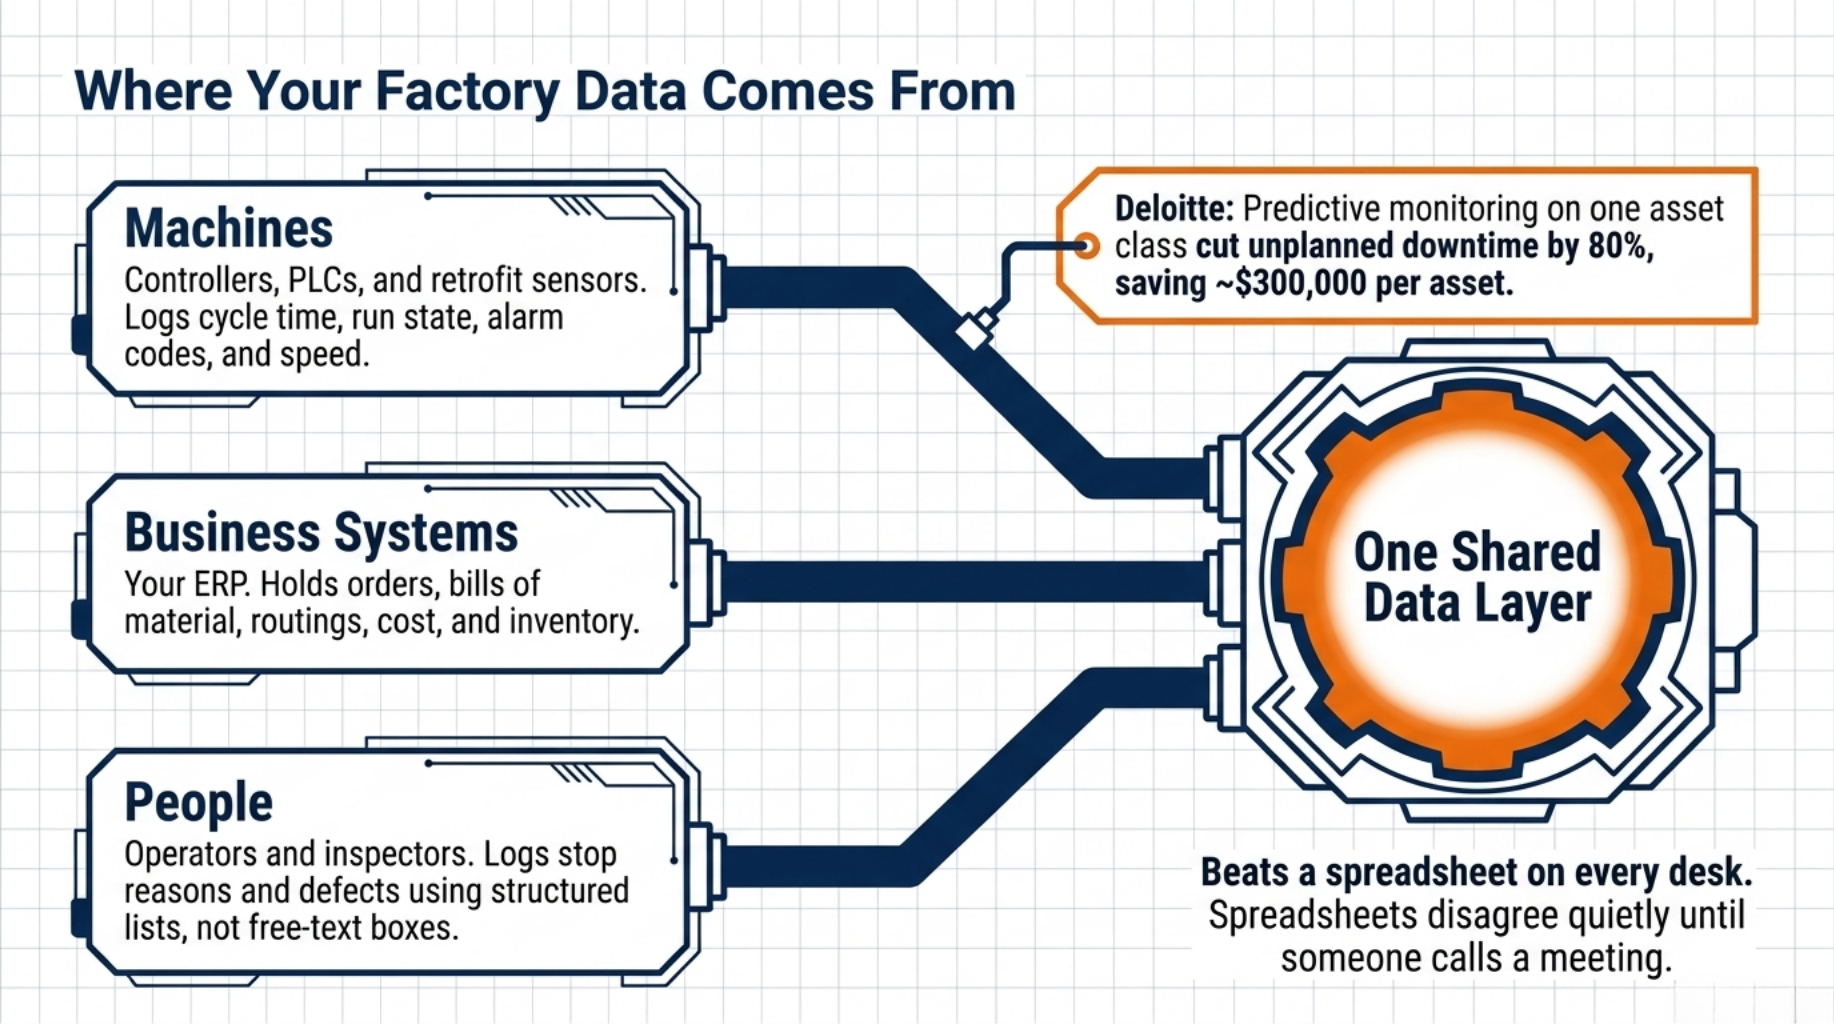
None of this works without data, so start with where yours already lives. Plants tend to connect three sources, and usually in this order.
Machine data comes first. Controllers and PLCs already log cycle time, run state, alarm codes and speed. On newer equipment you read it straight off the machine.
Older equipment is not a dead end. A basic vibration, current or temperature sensor can be fitted to a machine that predates your career. Deloitte reported a chemical manufacturer that added predictive monitoring to one class of asset and cut unplanned downtime on it by 80%, saving around $300,000 per asset.
Business systems come second. Your ERP holds orders, bills of material, routings, cost and inventory. Without it, machine data has no meaning. You know the line ran slow, but not what that cost you.
People fill the gaps sensors cannot reach. Operators log stop reasons. Inspectors record defects. Keep those entries short and structured, with a list to choose from instead of a free text box.
Then put everything in one place. A shared data layer beats a spreadsheet on every desk, because spreadsheets never argue with each other. They just disagree quietly until someone calls a meeting.
Data Quality and Governance Come First
Bad data scales faster than good data.
Once the data flows, the next risk is trusting it. Governance sounds like paperwork, but it is the cheapest fix on this list.
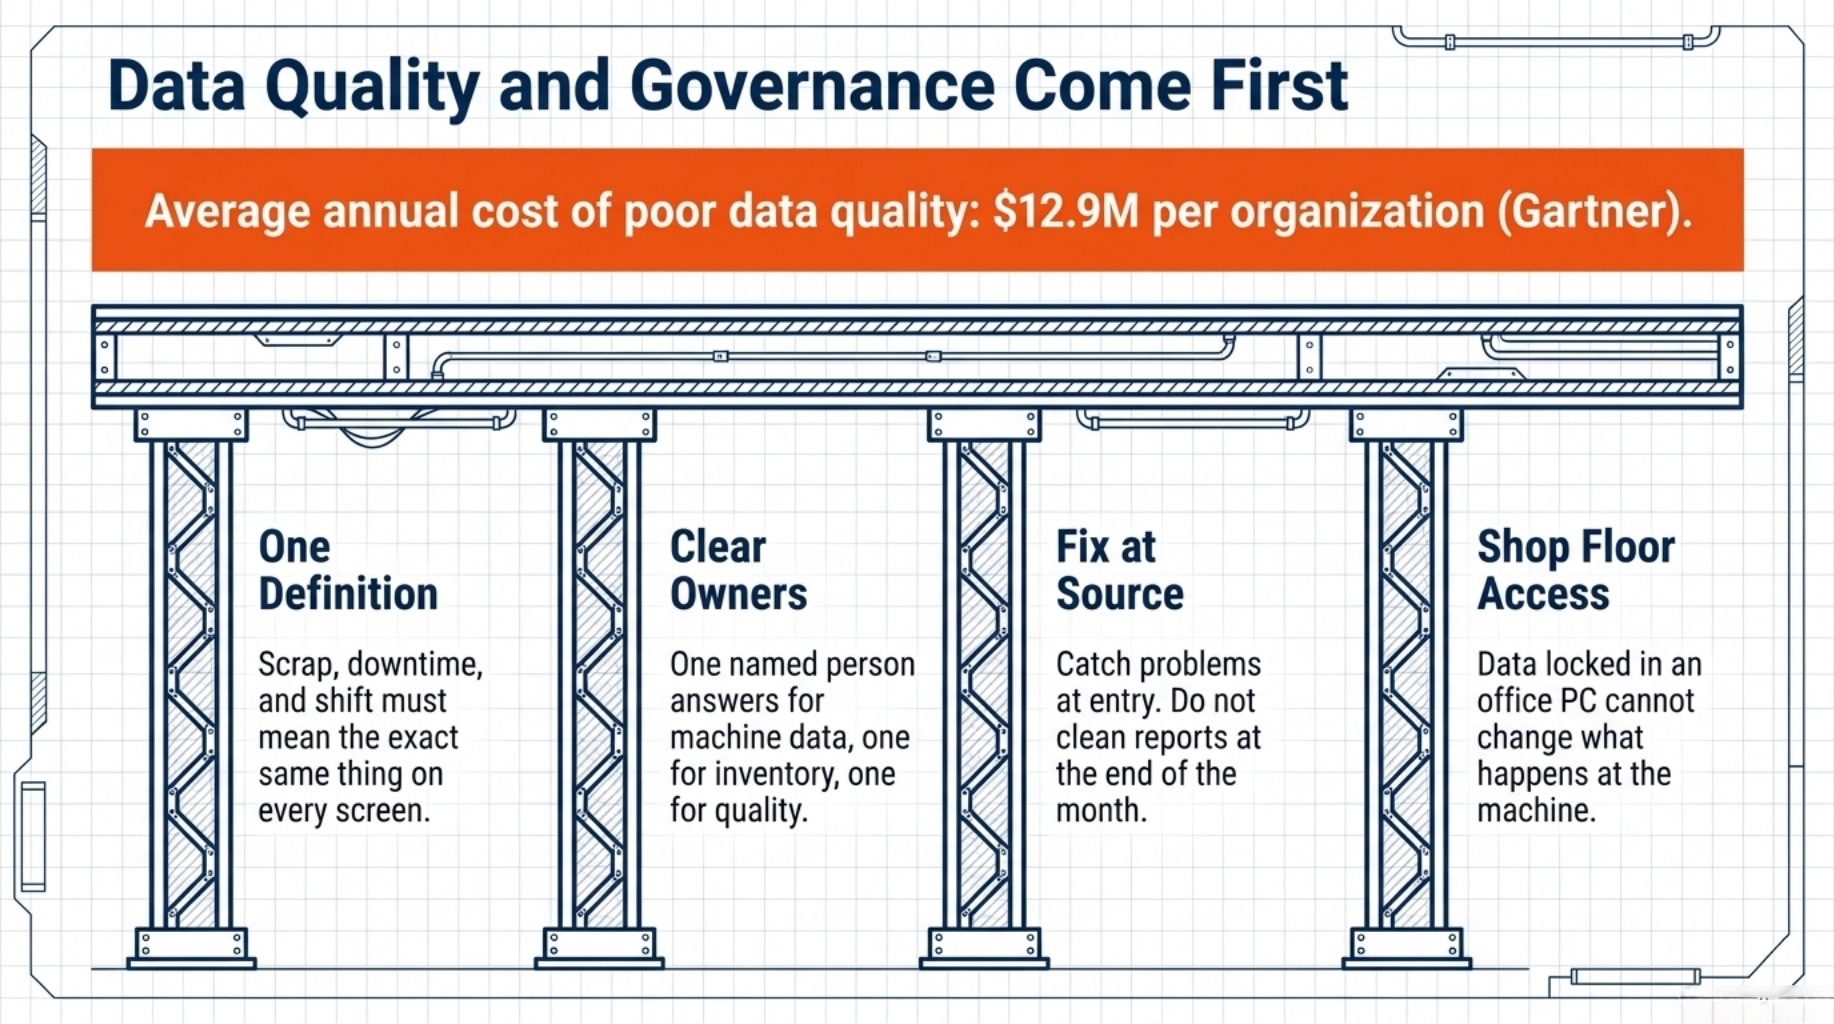
Gartner puts the average annual cost of poor data quality at $12.9 million per organisation. For a mid size plant the figure is smaller, but the pattern is identical: reports nobody believes and meetings spent arguing over which number is right.
Four rules cover most of it.
- Agree one definition for every term that matters. Scrap, downtime, good part and shift must mean the same thing on every screen.
- Name an owner for each source. One person answers for machine data, one for inventory, one for quality.
- Fix entry at the source. Cleaning a report each month treats the symptom, and a problem caught at entry costs a fraction of one caught after a bad decision.
- Set access so the floor sees what it needs. Data locked in the office cannot change what happens at the machine.
Do this before you buy anything. Clean data in a plain report beats messy data in a beautiful one.
Descriptive, Predictive, and Prescriptive Analytics
Reports explain yesterday. Prediction protects tomorrow.
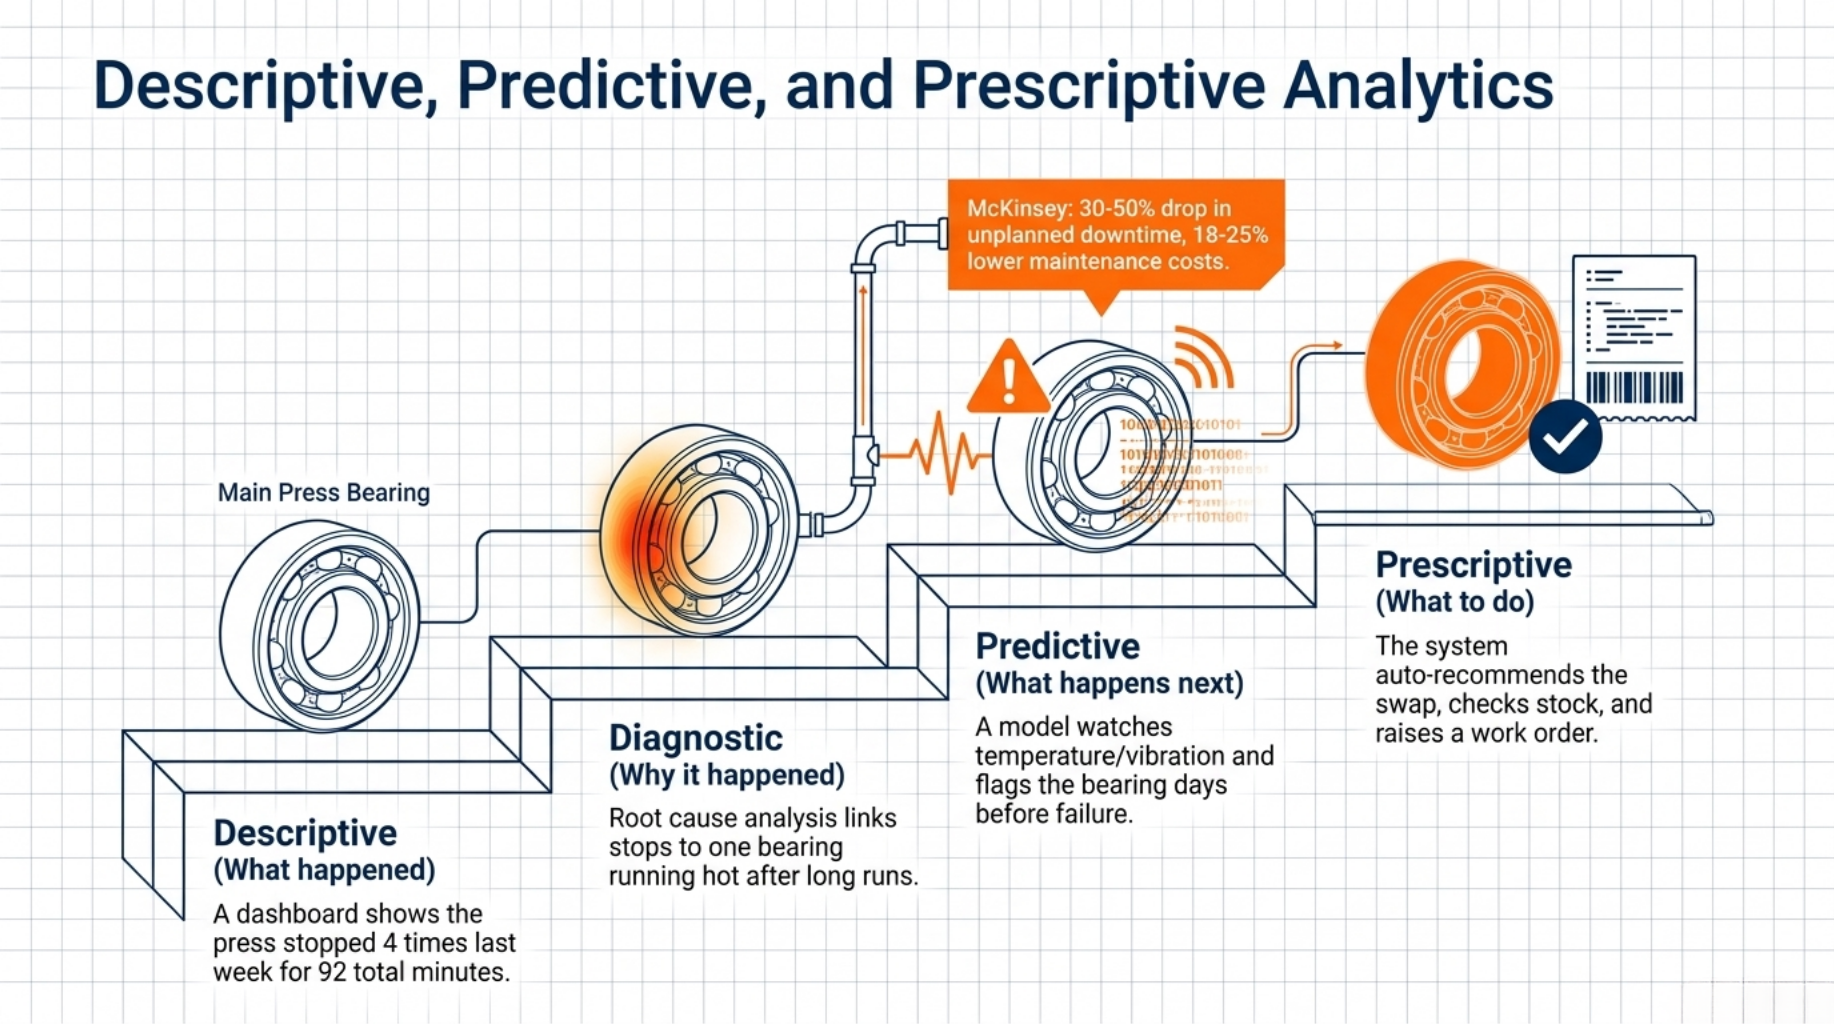
With trustworthy data in place, you can climb through the levels of analytics. Each one builds on the last, so follow a single example: a bearing on your main press.
Descriptive analytics tells you what happened. A dashboard shows the press stopped four times last week for 92 minutes in total, and the trend is rising.
Diagnostic analytics tells you why. Root cause analysis links those stops to one bearing running hot after long production runs. You needed clean machine and maintenance records to see that.
Predictive analytics tells you what happens next. With enough history, a model watches temperature and vibration and flags the bearing days before it fails. McKinsey research ties this move from reactive to predictive maintenance to a 30% to 50% fall in unplanned downtime and 18% to 25% lower maintenance costs.
Prescriptive analytics tells you what to do. The system recommends the swap, checks the part is in stock and raises the work order for the next planned stop.
Do not start at the bottom of that list. Prescriptive needs prediction, prediction needs clean history, and clean history needs the basics you just put in place.
Use Cases That Pay Back First
Start where the money leaks. Prove it. Then expand.
Pick one problem with a number attached, prove the gain, then move on. DiamondBack, a truck cover manufacturer, shows why this matters: before its systems were joined up, reporting took 20 days or more and staff did not trust the figures enough to make purchasing calls. Four areas usually leak first.
Quality
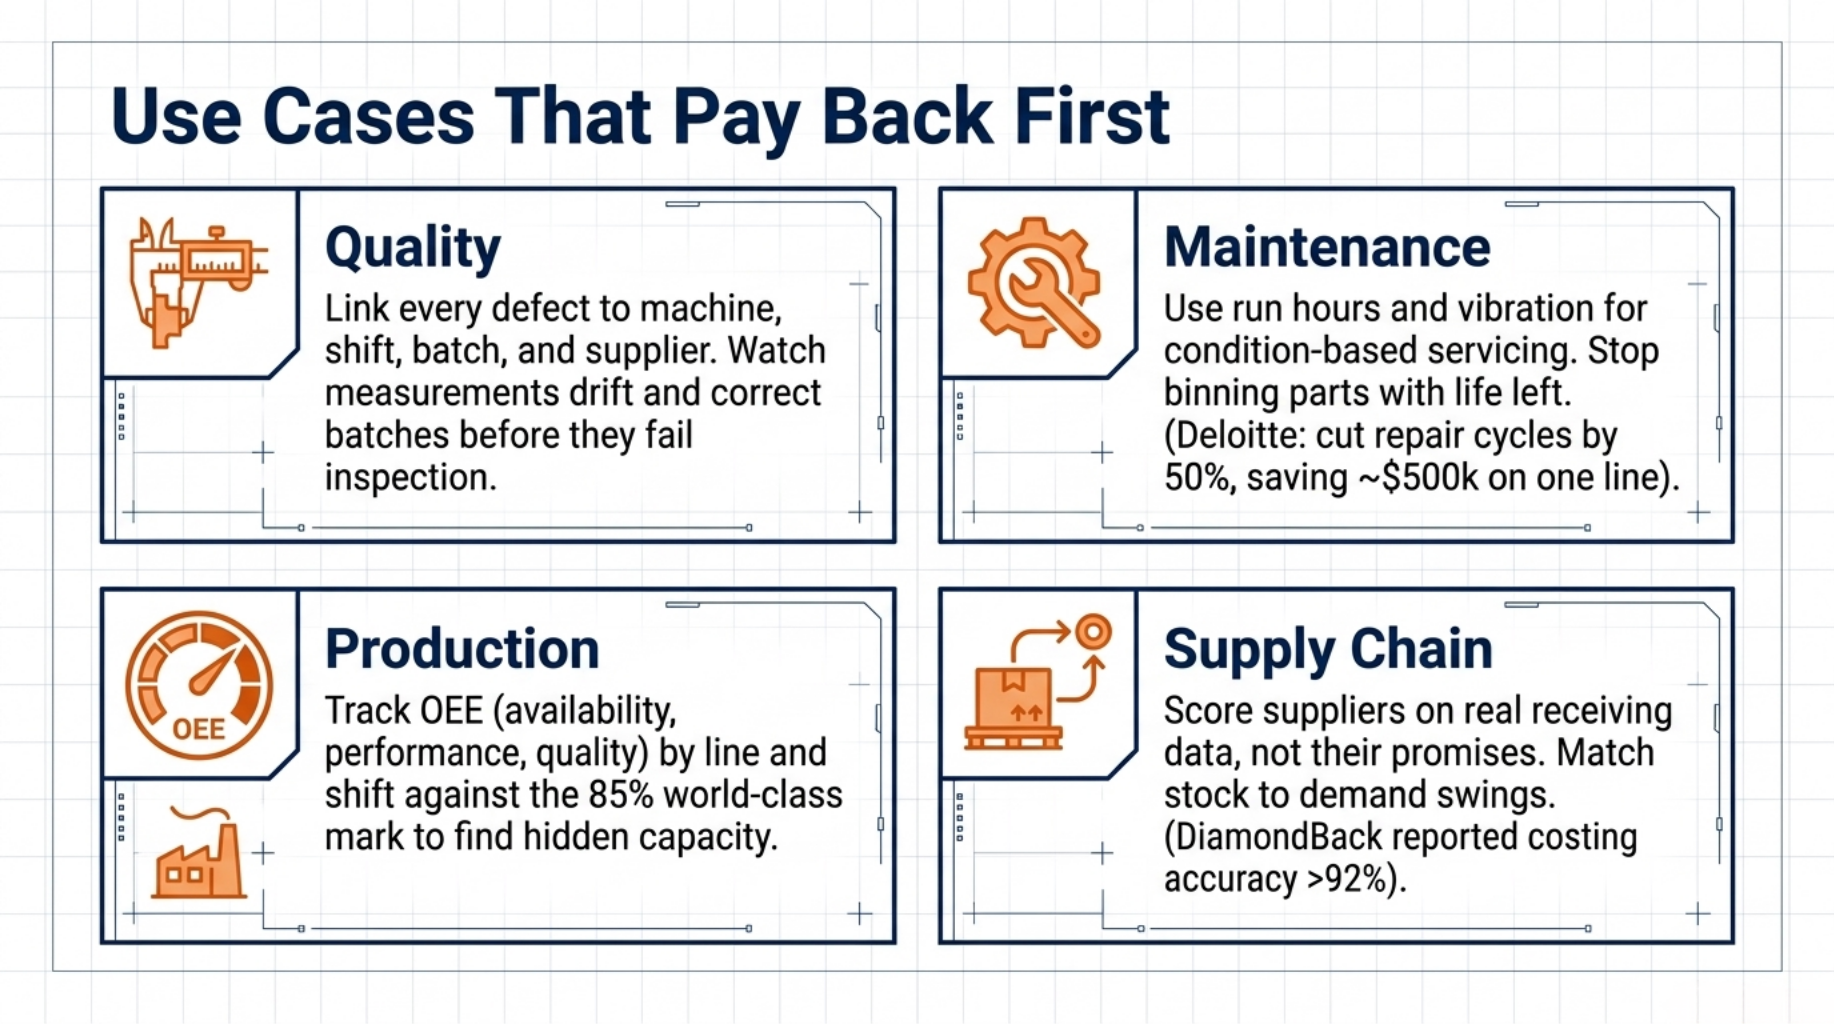
Link every defect record to machine, shift, batch and supplier. Patterns appear fast, and they are usually specific: one press, one night shift, one supplier lot. Watch measurements drift while still inside tolerance and you can correct a batch before it fails inspection. That turns a scrapped run into a small adjustment.
Maintenance
Run hours, vibration and temperature tell you the true condition of a machine. Use them to schedule work when the data says so, not when the calendar does. Deloitte reported a manufacturer that cut repair cycle time for defects by 50% and saved around $500,000 on one product line. Condition based servicing also stops you binning parts that still have life left.
Production
OEE splits output into availability, performance and quality, with 85% as the usual world class mark. Track it by line and by shift and the real constraint shows itself, often somewhere nobody suspected. Then compare planned cycle time against actual. Small daily gaps are where your hidden capacity goes.
Supply Chain
Score suppliers with your own receiving data, not their promises. Lead time, defect rate and short shipments build a clear picture inside a quarter. Match stock to real demand swings instead of a twelve month average. DiamondBack used connected data to avoid out of stock parts and now reports costing accuracy above 92%.
Building a Manufacturing Data Team
Your best analyst already works on the shop floor.
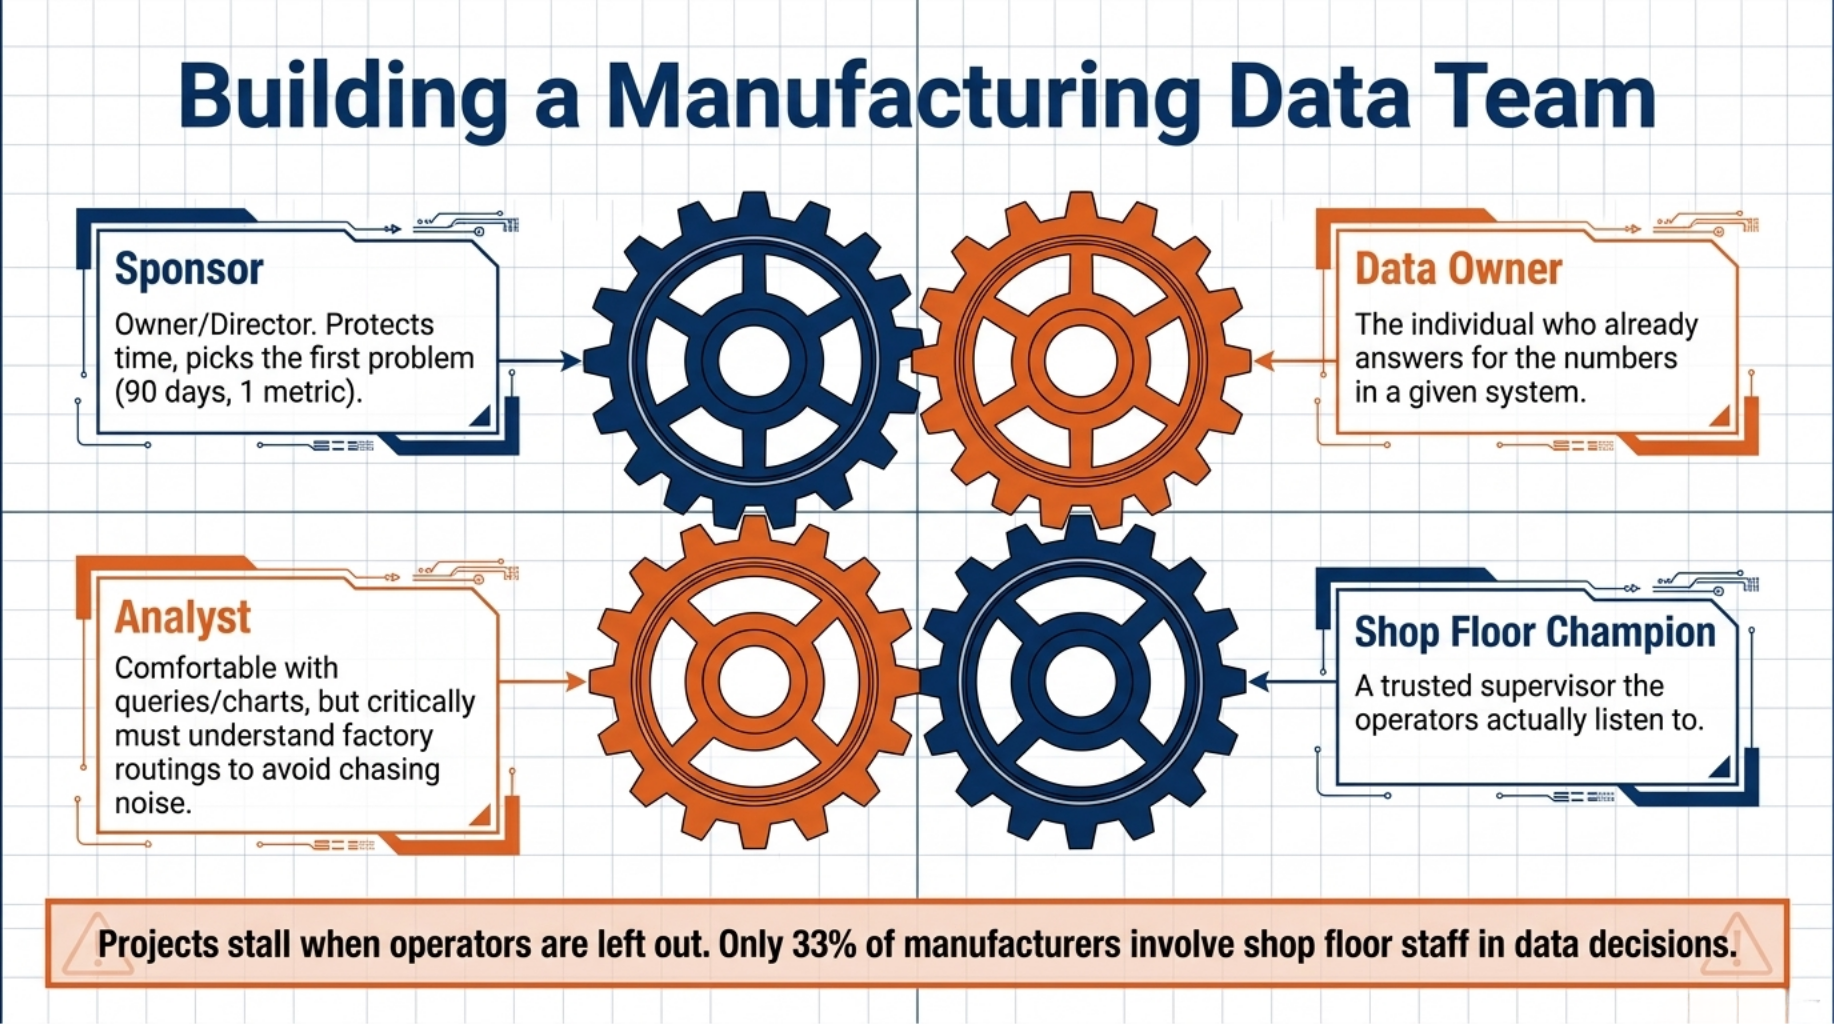
Use cases need owners, and that team is smaller than most people expect. Four roles matter, and a small plant can fill them part time.
- Sponsor: the owner or operations director who protects the time and picks the first problem.
- Data owner: whoever already answers for the numbers in a given system.
- Analyst: someone at ease with queries and charts, often already sitting in finance or planning.
- Shop floor champion: a supervisor the operators actually listen to.
Pair process knowledge with data skill. An analyst who cannot read a routing will chase noise, and a supervisor who knows the press but not the report will guess.
Give that team one problem and one deadline. Ninety days and a single metric beats a broad remit and no finish line.
Then teach operators to read and act on the numbers. Only 33% of manufacturers give shop floor staff any role in data driven decisions, which is exactly where most projects quietly stall.
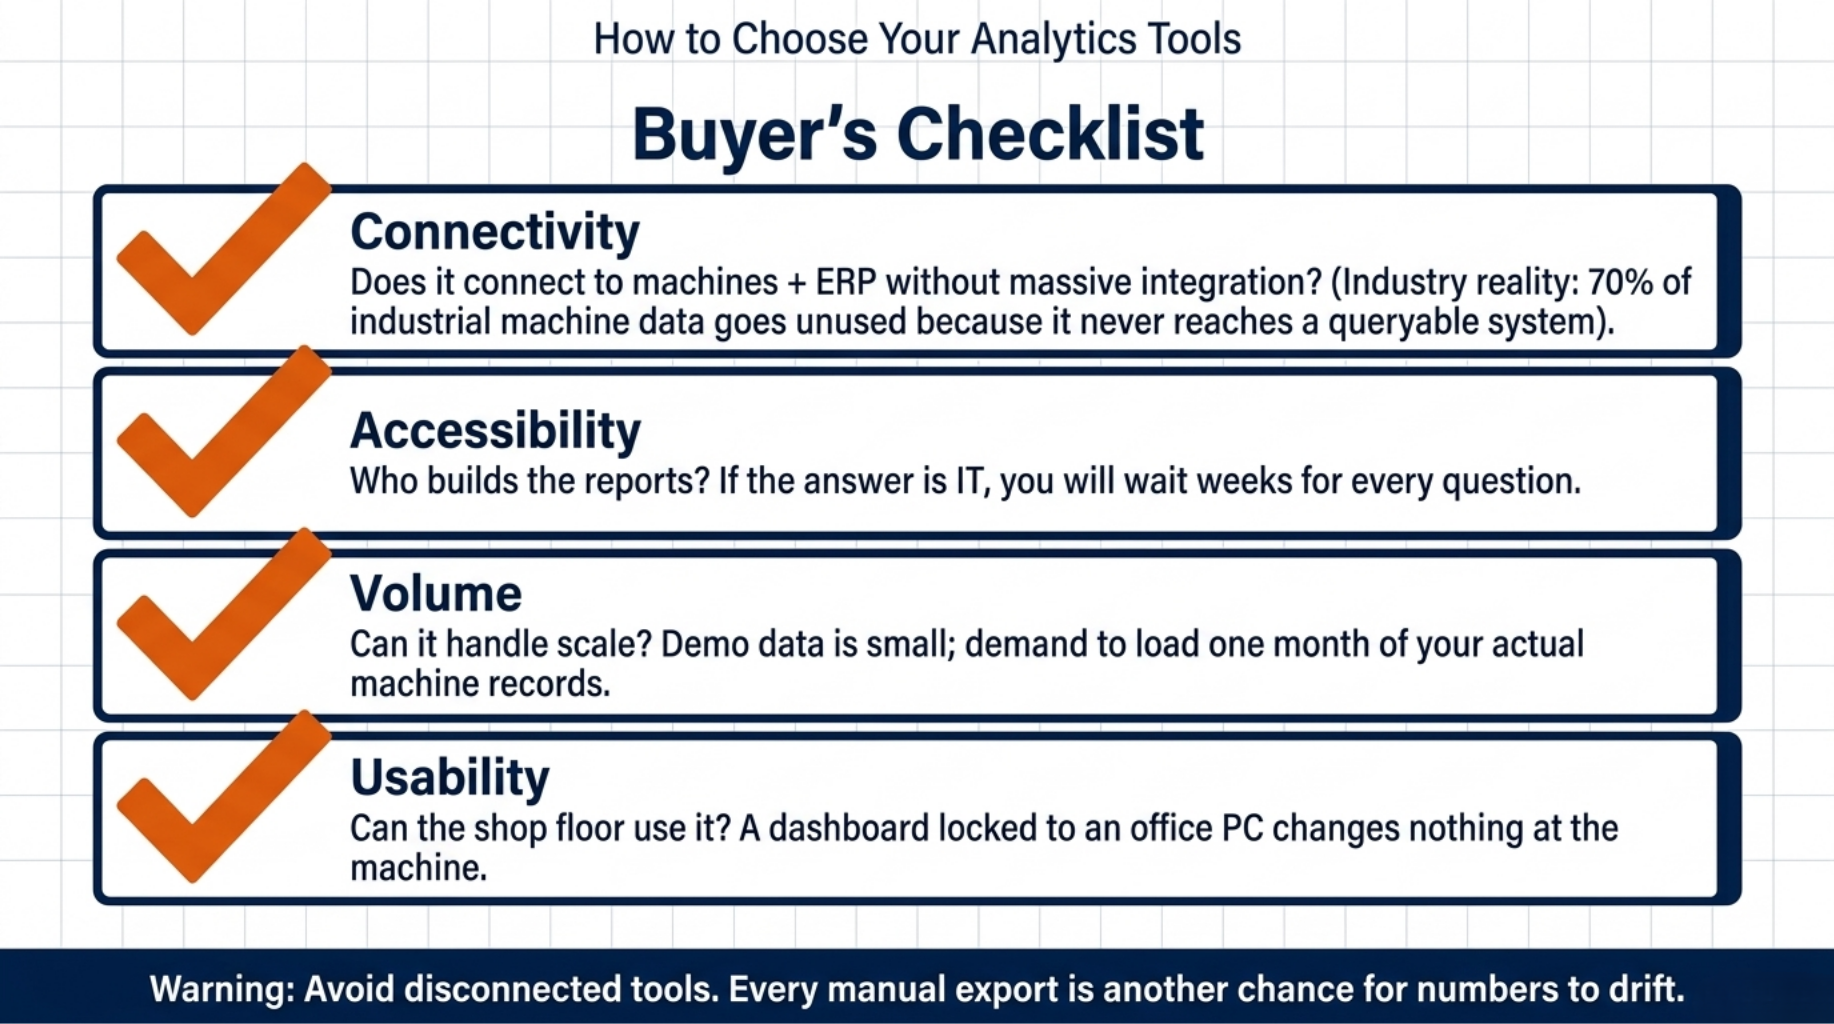
How to Choose Your Analytics Tools
Buy for the questions you ask, not the charts you like.
With a team and a use case, you can judge software properly. Take this checklist into every demo.
- Does it connect to both your machines and your business system without a separate integration project? Around 70% of industrial machine data goes unused, mostly because it never reaches a system where anyone can query it.
- Who can build a report? If the answer is IT, you will wait weeks for every question you ask.
- Does it hold up on real volumes? Demo data is small and tidy, so ask to load a month of your own machine records.
- Can people use it on the floor? A dashboard that only opens on an office PC changes nothing at the machine.
One warning. Tools that sit apart from your core system need constant feeding, and every export is another chance for numbers to drift.
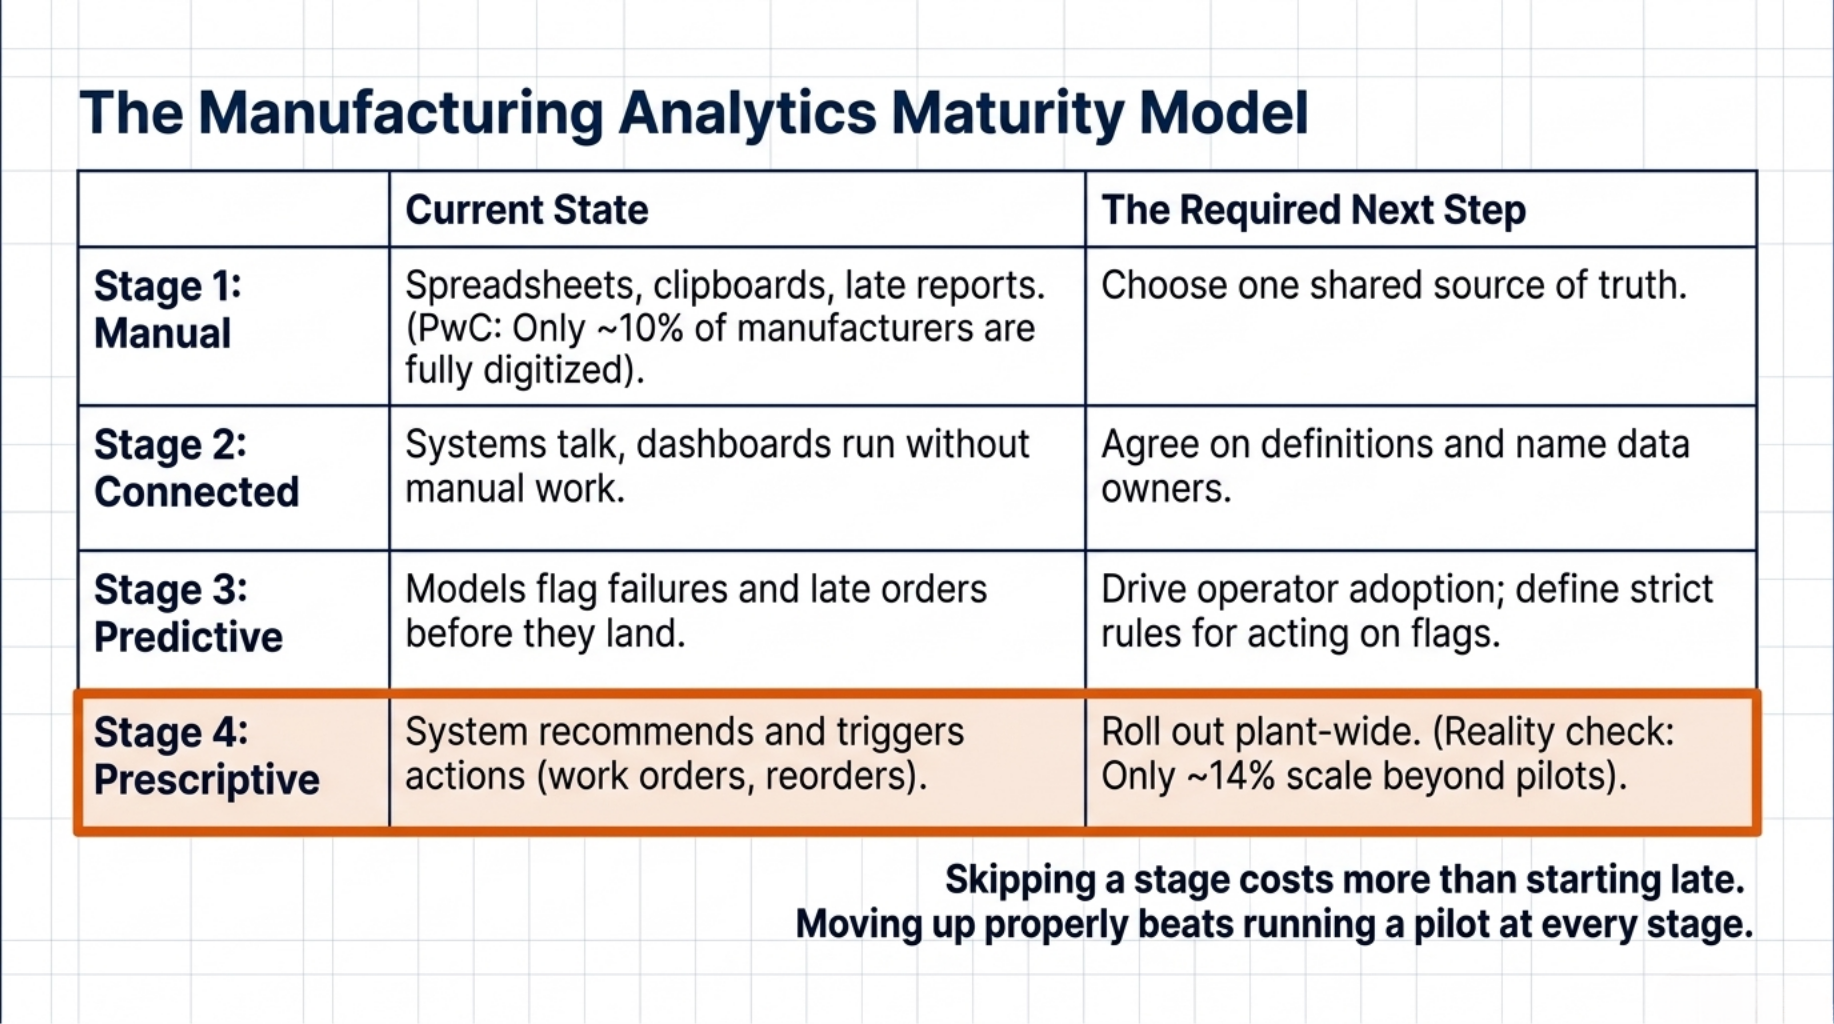
The Manufacturing Analytics Maturity Model
Skipping a stage costs more than starting late.
Before you spend, work out where you stand. Place your plant on this model, then take the one next step that fits.
Stage 1, Manual. Data lives in spreadsheets, clipboards and email, and reports are built by hand and arrive late. Next step: choose one shared source of truth and move production and inventory into it. PwC research found only about 10% of manufacturers are fully digitised, so most plants sit here or just above.
Stage 2, Connected. Systems talk to each other and dashboards run without manual work. Arguments now centre on definitions rather than access. Next step: agree what each term means and name an owner for every source.
Stage 3, Predictive. Models flag likely failures and late orders before they land. The risk at this stage is alerts nobody acts on. Next step: operator adoption, with a clear rule for what happens when a flag appears.
Stage 4, Prescriptive. The system recommends actions and triggers them, from work orders to reorder points. Next step: roll it out plant wide and hold every area to the same numbers.
Only around 14% of manufacturers have scaled digital efforts beyond pilots, so the top stages remain open ground. Moving up one stage properly beats running a pilot at every stage.
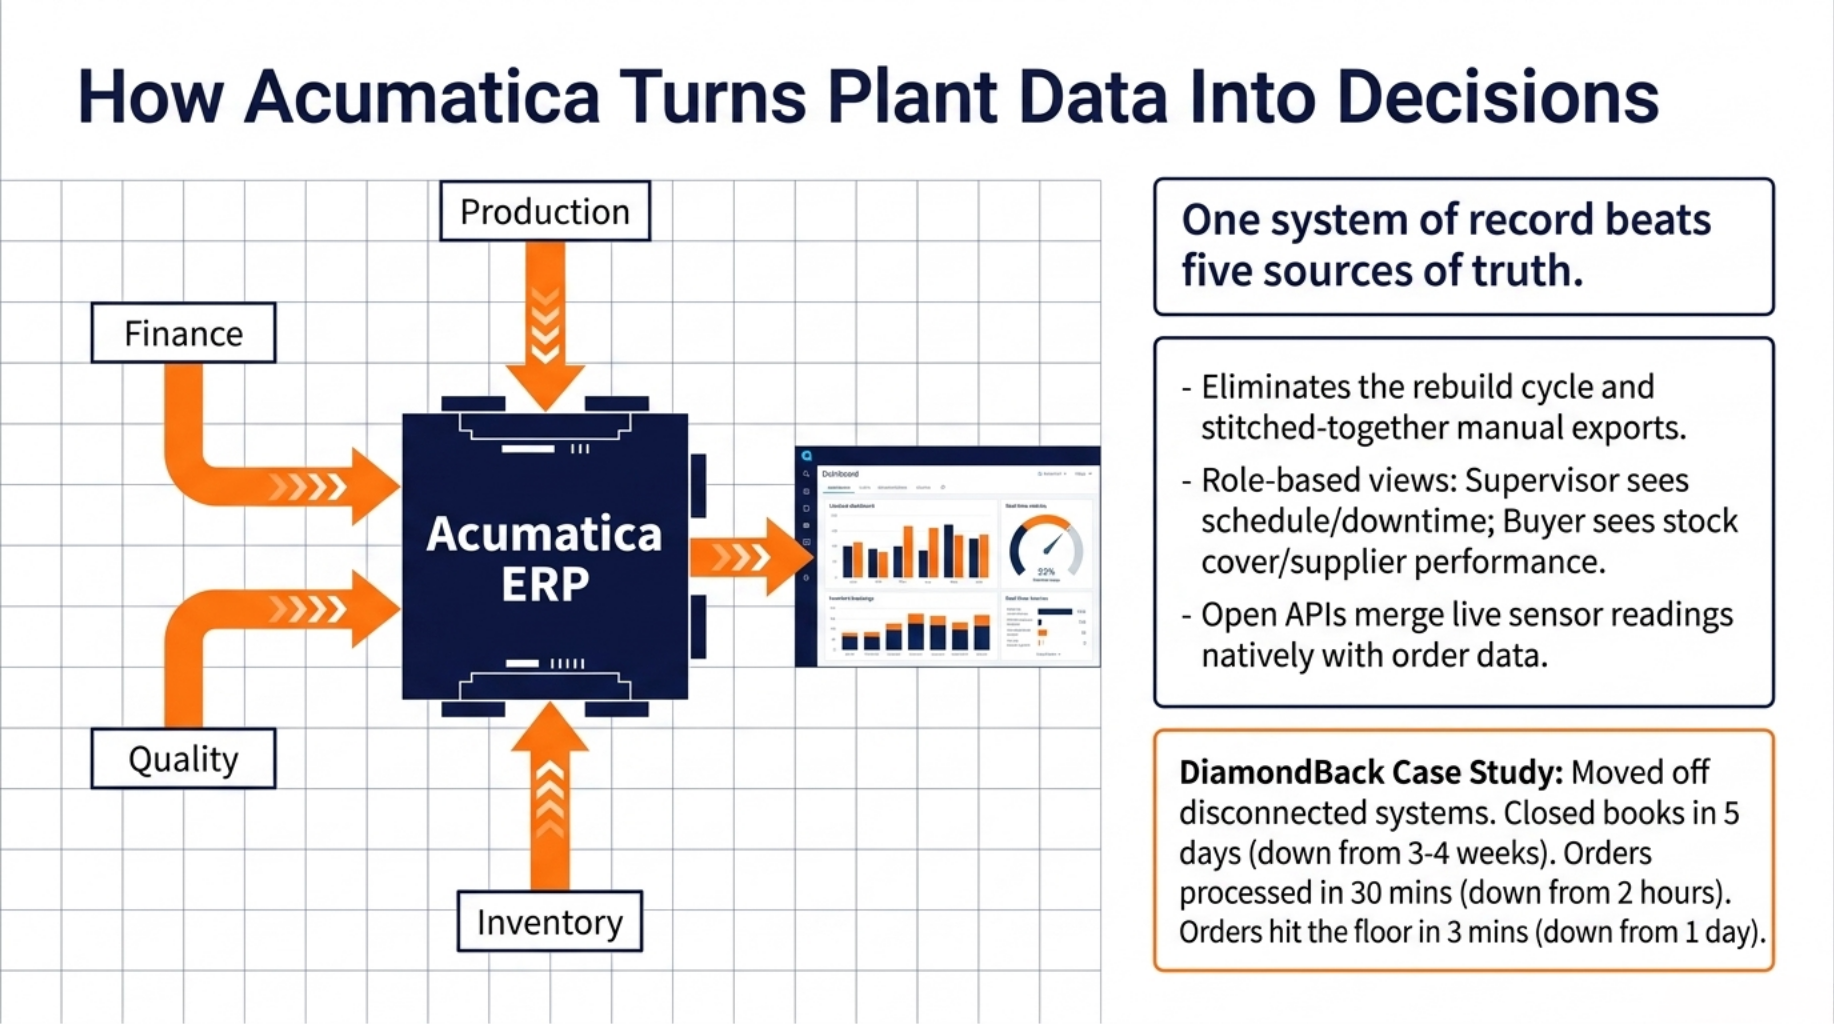
How Acumatica Turns Plant Data Into Decisions
One system of record beats five sources of truth.
All of this gets easier when the data already sits together, which is the argument for running analytics inside your ERP rather than beside it.
Acumatica holds production, inventory, quality and finance records in one system. A scrap entry, the work order behind it and the cost of that material are one record, not three exports stitched together later. That removes the rebuild cycle that eats analyst time.
Role based dashboards give each user the numbers they own. A production supervisor sees schedule and downtime, while a buyer sees stock cover and supplier performance. Built in reporting lets them change a view without raising a ticket.
Open APIs pull machine and sensor readings into the same record, so predictive work can draw on machine data and order data at once.
DiamondBack moved off disconnected systems and now closes its books in five days instead of three to four weeks, processes orders in 30 minutes rather than two hours, and gets an order to the manufacturing floor in three minutes instead of a full day.
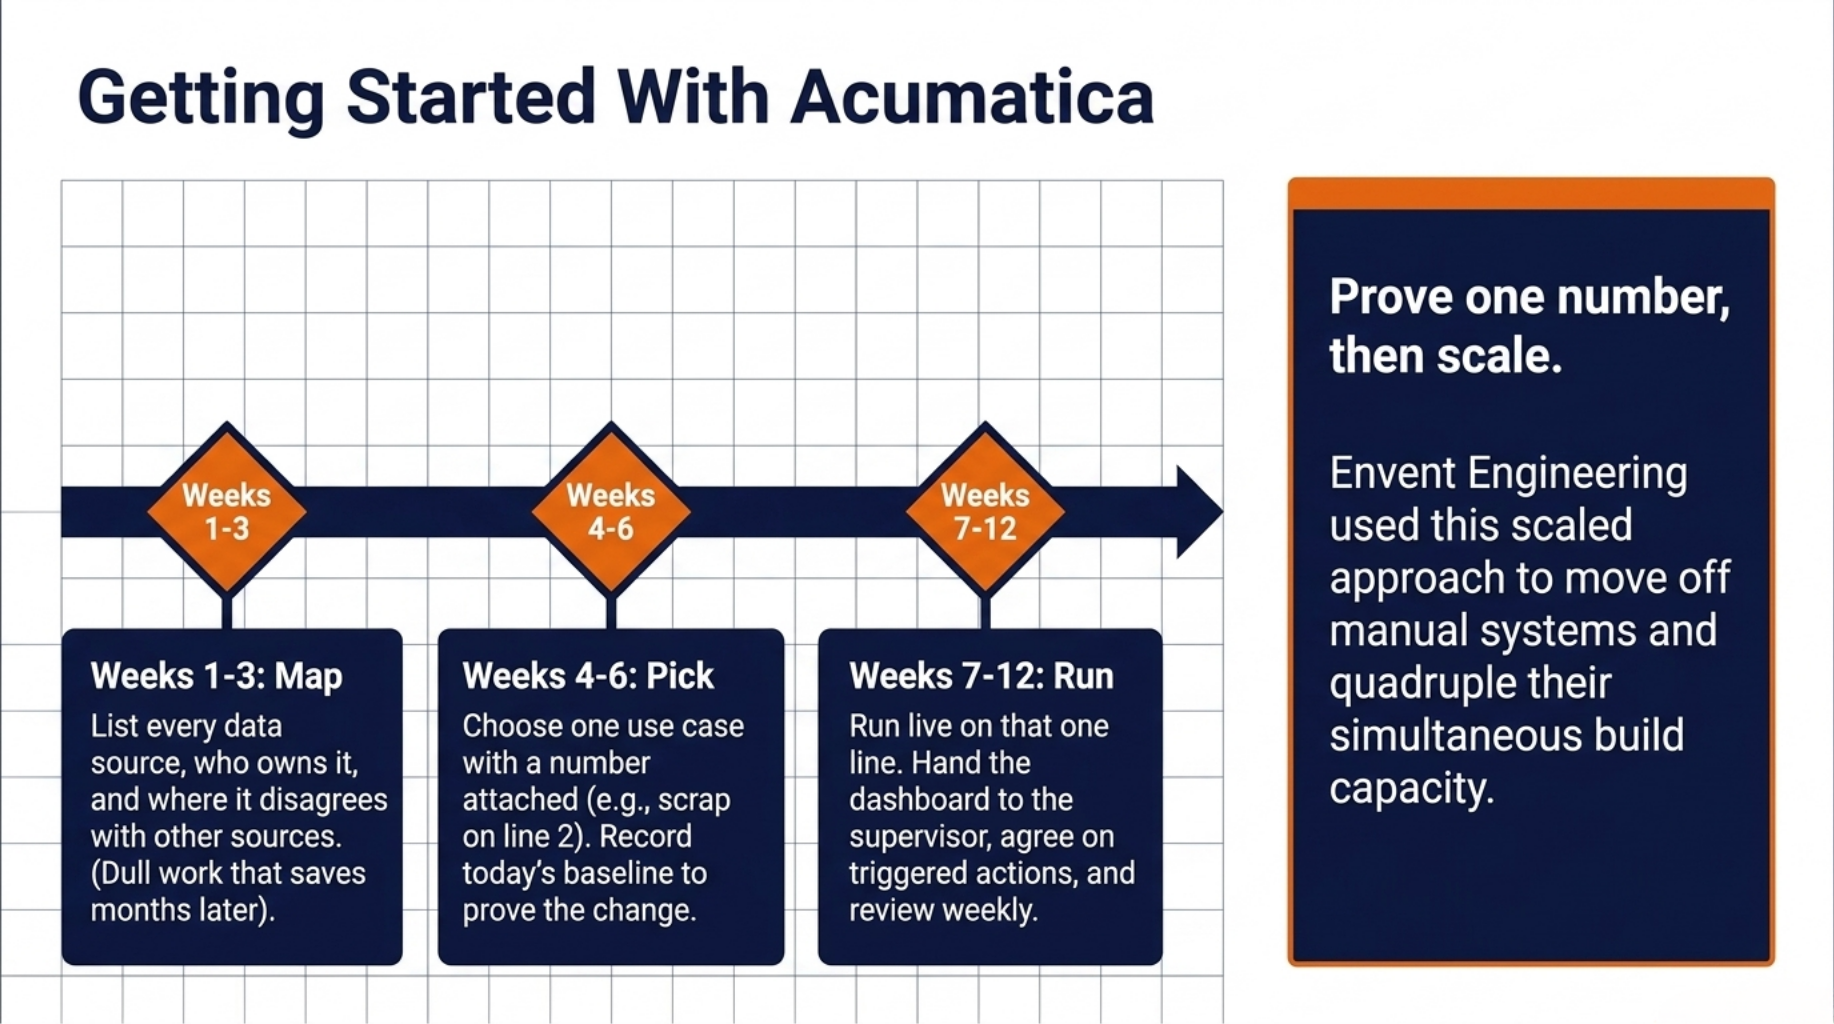
Getting Started With Acumatica
Pick one problem. Measure it. Then scale what works.
Here is a ninety day path you can run without pausing production.
Weeks 1 to 3: map your data. List every source, who owns it, and where it disagrees with another source. The work is dull and it saves you months later.
Weeks 4 to 6: pick one use case with a number attached. Scrap on one line, downtime on one machine group, or supplier defect rate. Write down today’s figure so you can prove the change.
Weeks 7 to 12: run it live on that one line. Hand the supervisor the dashboard, agree what action each number triggers, and review it weekly.
Envent Engineering did the same thing at scale, moving off manual systems and quadrupling what it could build at once. Prove one number first, then grow.
Wrapping Up
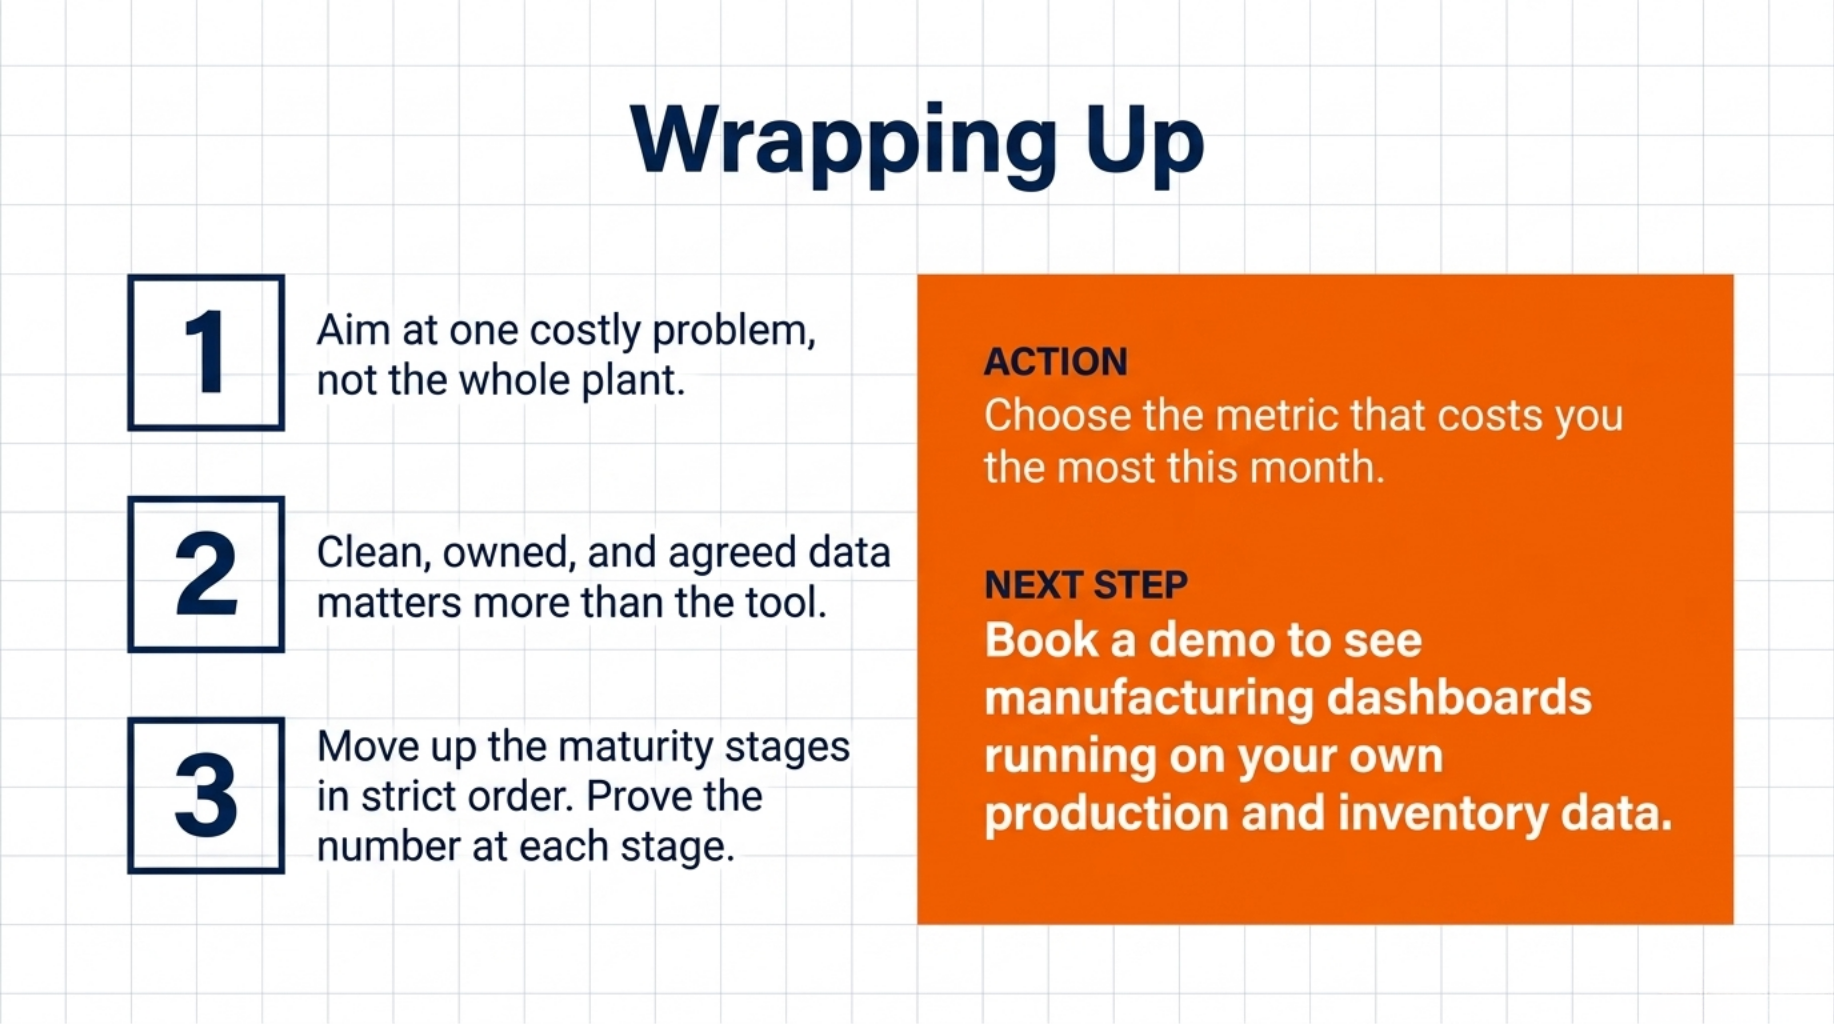
Manufacturing data analytics pays back fastest when you aim it at one costly problem instead of the whole plant. Clean, owned and agreed data matters more than the tool you pick, because a multi million pound data quality problem usually starts with a definition nobody wrote down. Move up the maturity stages in order and prove the number at each one.
Your first move is small. Choose the metric that costs you most this month, then find out whether you can measure it properly today.
Book a demo to see manufacturing dashboards running on your own production and inventory data.
FAQ
Q1: What is manufacturing data analytics?
A: It is the practice of collecting data from machines, systems, and people in a plant, then using it to improve quality, uptime, output, and delivery.
Q2: How do you collect data from factory machines?
A: Modern machines share data through their controllers, while older machines can be retrofitted with low cost sensors that feed the same system.
Q3: What is the difference between predictive and prescriptive analytics?
A: Predictive analytics tells you what is likely to happen next, while prescriptive analytics recommends the action to take and can trigger it for you.
Q4: Do you need a data scientist to start?
A: No, most plants start with an operations lead and an analyst who know the process, and add specialist skills once the first use case proves value.
Q5: How long before analytics shows a return?
A: A focused first project on one line or one machine group often shows measurable results within one to two quarters.